Posted on

Monthly Reports | October 2024

Monthly Digital Advertising Results | October 2024

For more in-depth data, custom reports, or specific metrics, please contact [email protected] 

Note: The Marketing and Data Teams are currently developing a Digital Advertising Power BI dashboard to enhance monthly reporting and increase leverage.

Google Business

Average Performance of Google Business Metrics - Per Store

Google Business Profile reporting metrics primarily track how customers interact with your business listing on Google, for each Stotz Equipment location. These metrics help you understand customer behavior and optimize your business’s visibility on Google.

Calls
0

Number of times the Call
link was clicked

Directions
0

Number of times the Directions
link was clicked

Website Clicks
0

Number of times the Website
link was clicked

Overall Rating
0
Average star rating based
on reviews

Average Number of Google Searches - Per Store

Searches made using the standard Google Search tool or the using the URL bar in Google Chrome. These results are shown under the “All” tab in Google.
Mobile
1295
Desktop
699

Average number of Google Maps searches - Per Store

Searches for locations in Google Maps. Mobile results include searches both in the Google Maps App and under the “Maps” tab in a mobile web browser.

Mobile
2151
Desktop
226

Google Ads

Average Search Ad Performance - Per Store

A Google Search ad targets users on search result pages, targeting based on user behavior.

Google Search ads target users based on specific search queries and browsing behaviors, offering tailored messaging that aligns with user intent. This precise targeting tends to yield higher cost per click, quality impressions, and conversions, as ads are more relevant to users actively interested in John Deere, agriculture, tractors, golf equipment, construction, etc.

Impressions
0
Number of times an ad is displayed on Google or the Google Network
Clicks
0
Number of times an ad is
clicked by users
Conversions
0

An action by a user after clicking an ad, such filling out a form.

Note: Conversion actions can be defined individually per ad.

Cost Per Click
$ 0
Amount paid each time a user clicks on an ad
Monthly Cost
$ 0

Before Co-Op

Monthly Cost
$ 0

After Co-Op

Average PMax Ad Performance - Per Store

A Google PMax ad, or Performance Max campaign, is a type of advertising that automatically optimizes ad placement across all Google platforms, including Search, Display, YouTube, and more, based on specific performance goals.

Google PMax ads automate ad placements across all Google platforms (including Search, Display, YouTube, Gmail, and more) based on performance goals but without the granular control over context and placement. While PMax campaigns to optimize outcomes with a lower cost-per-click, they might not match the intent-driven engagement of ads.

Impressions
0
Number of times an ad is displayed on Google or the Google Network
Clicks
0
number of times an ad is
clicked by users
Conversions
0

An action by a user after clicking an ad, such filling out a form.

Cost Per Click
$ 0
Amount paid each time a user clicks on an ad
Monthly Cost
$ 0

Before Co-Op

Monthly Cost
$ 0

After Co-Op

Average Google Ad Conversions - Per Store

These metrics show the number of Google Ads served to users based on proximity to their local Stotz Equipment and the actions taken by users as a direct result of the ad. These are the average results of local ads across all Google platforms, per store.     

Local Impressions
0

The number of times a location-based ad was shown

Store Visits
0

Number of times people visited a store in-person after clicking a local ad

Call Clicks

Number of times people clicked the Call button during or after clicking a local ad

Driving Directions
0

Number of times people clicked Get directions after clicking a local ad

Website Visits
0

Number of times people were taken to a store’s location page on stotzequipment.com after clicking a local ad

Facebook

Facebook ads target users based on their profile information, preferences, and online activity, displaying tailored advertisements across all of Meta’s network which includes Facebook, Instagram, Messenger, and the Audience Network, to meet specific marketing objectives.

Meta targets users for Facebook Ads by analyzing extensive data on user activities and preferences across its platforms. This includes demographic information, user interactions, and behaviors such as likes, shares, and comments. Ads are then personalized and shown to users based on their past online activities, interests, and the likelihood of engaging with specific content, ensuring that advertisers can reach highly specific audiences likely to be interested in their products or services.

Average CUT Ad Performance - Per Store

Impressions
0
The number of times an ad is displayed across any of Meta’s platforms
Clicks
0
The total number of interactions where users click on an ad within Meta’s platforms
Cost Per Click
$ 0
The average cost paid for each click on an ad across all of Meta’s platforms
Monthly Cost
$ 0

Before Co-Op

Monthly Cost
$ 0

After Co-Op

Average CCE Ad Performance - Per Store

Impressions
0
The number of times an ad is displayed across any of Meta’s platforms
Clicks
0
The total number of interactions where users click on an ad within Meta’s platforms
Cost Per Click
$ 0
The average cost paid for each click on an ad across all of Meta’s platforms
Monthly Cost
$ 0

Before Co-Op

Monthly Cost
$ 0

After Co-Op

Average Mid Ag & Hay Ad Performance - Per Store

Impressions
0
The number of times an ad is displayed across any of Meta’s platforms
Clicks
0
The total number of interactions where users click on an ad within Meta’s platforms
Cost Per Click
$ 0
The average cost paid for each click on an ad across all of Meta’s platforms
Monthly Cost
$ 0

Before Co-Op

Monthly Cost
$ 0

After Co-Op

Lean Media

Lean Media collaborates with advertisers to plan, design, execute, and measure digital ad campaigns, using programmatic buying to target precise audiences across devices and platforms.

Third-Party Hay & Forage Ads

Impressions
0

Number of times an ad is displayed to potential viewers on various platforms within Lean Media’s network

Clicks
0

Number of times users actually click on an ad, indicating engagement or interest

Click Through Rate
0 %

Measures the percentage of impressions that resulted in a click, providing insight into the ad’s effectiveness

Conversions
0

Number of actions taken by users after clicking the ad, such as making a purchase or signing up, which aligns with the campaign’s goals

Third-Party Livestock Ads

Impressions
0

Number of times an ad is displayed to potential viewers on various platforms within Lean Media’s network

Clicks
0

Number of times users actually click on an ad, indicating engagement or interest

Click Through Rate
0 %

Measures the percentage of impressions that resulted in a click, providing insight into the ad’s effectiveness

Conversions
0

Number of actions taken by users after clicking the ad, such as making a purchase or signing up, which aligns with the campaign’s goals

Search Retargeting

Search Retargeting involves targeting users who have previously searched for keywords or phrases related to your products or services, even if they have not visited your website.

Impressions
0

Number of times an ad is displayed to potential viewers on various platforms within Lean Media’s network

Clicks
0

Number of times users actually click on an ad, indicating engagement or interest

Click Through Rate
0 %

Measures the percentage of impressions that resulted in a click, providing insight into the ad’s effectiveness

Conversions
0

Number of actions taken by users after clicking the ad, such as making a purchase or signing up, which aligns with the campaign’s goals

Site Retargeting

Site Retargeting targets users who have previously visited your website, displaying relevant ads to them as they browse other sites, to encourage them to return and complete a purchase or another desired action.
Impressions
0

Number of times an ad is displayed to potential viewers on various platforms within Lean Media’s network

Clicks
0

Number of times users actually click on an ad, indicating engagement or interest

Click Through Rate
0 %

Measures the percentage of impressions that resulted in a click, providing insight into the ad’s effectiveness

Conversions
0

Number of actions taken by users after clicking the ad, such as making a purchase or signing up, which aligns with the campaign’s goals

Google Analytics

Web analytics service offered by Google that tracks and reports website traffic, providing insights into user behavior, engagement, and conversion metrics.

Site Visitors
0
A website visitor refers to an individual who interacts with your website during a specific time frame
First-time Site Visitors
0

Each visitor is tracked through a unique identifier, allowing the system to distinguish between new and returning visitors

Average Time Spent on Site
0 s

Total duration that a visitor stays on your website
during a single session

User Acquisition

Where are website visitors coming from? How are they finding out about www.stotzequipment.com?
FB Audience Network - Paid
10.6K
Google - Cost-per-click
7.3K
Google - Organic
6.9K
Facebook - Paid
6K
Direct Traffic
4.6K
Bing - Organic
633
Instagram - Paid
563
Deere.com
444

Top Pages

Theses are the pages that receive the most visits within a given time frame. This metric provides insights into which parts of the website are most engaging or popular, as well as a correlation to relative ad campaigns across all platforms.

Home Page
9.7K
Used Equipment
7.8K
CCE
6.8K
More Than Paint Deep Campaign
4.6K
CUTs
4K
Midsize Ag & Hay
3.4K
Current Openings
1.6K

Digital Sales Leads

stotzequipment.com

These metrics reflect the request-a-quote form submissions from our website.

Request a Quote Leads
0
Request-a-quote leads are generated when users fill out a form expressing interest on a specific equipment web page.
Consumer Products
38
Ag
10
CCE
4
Golf & Turf
10
CUTs
16

John Deere Certified Digital Program (JDCDP)

John Deere | Shift Digital

The John Deere Certified Digital Program/Digital Health Check evaluates the follow up to digital sales leads, online customer experience, and other points of customer engagement for the Sales and Service departments at each store. Reports are published monthly in the JDCDP dashboard.

Average Response Percentage to Customer Inquiries - Per Store

John Deere’s Goal is 75%

Phone Sales
0 %

Response to sales inquiries made over the phone. These scores are measured by test calls made by John Deere/Shift digital.

Phone Service
0 %

Response to service requests made over the phone. These scores are measured by test calls made by John Deere/Shift digital.

Average Response to Digital Sales Leads - Digital Sales (Corp) Dept.

John Deere’s Goal is that 75% of digital sales leads are followed up on, that email response times are less than 60min, and phone call/text response times are less than 30min.

Digital Sales Leads
0 %

Response to request-a-quote/sales leads on whole goods made through the website. John Deere goal is 75%.

Phone Leads
0 min

Response time to digital sales leads made over the phone. John Deere goal is less than 60min.

E-mail Leads
0 min

Response time to digital sales leads made via email. John Deere goal is less than 30min.

Looking for More?

Posted on

Monthly Reports | September 2024

Monthly Digital Advertising Results | September 2024

For more in-depth data, custom reports, or specific metrics, please contact [email protected] 

Note: The Marketing and Data Teams are currently developing a Digital Advertising Power BI dashboard to enhance monthly reporting and increase leverage.

Google Business

Average Performance of Google Business Metrics - Per Store

Google Business Profile reporting metrics primarily track how customers interact with your business listing on Google, for each Stotz Equipment location. These metrics help you understand customer behavior and optimize your business’s visibility on Google.

Calls
0

Number of times the Call
link was clicked

Directions
0

Number of times the Directions
link was clicked

Website Clicks
0

Number of times the Website
link was clicked

Overall Rating
0
Average star rating based
on reviews

Average Number of Google Searches - Per Store

Searches made using the standard Google Search tool or the using the URL bar in Google Chrome. These results are shown under the “All” tab in Google.
Mobile
3159
Desktop
1266

Average number of Google Maps searches - Per Store

Searches for locations in Google Maps. Mobile results include searches both in the Google Maps App and under the “Maps” tab in a mobile web browser.

Mobile
17272
Desktop
1208

Google Ads

Average Search Ad Performance - Per Store

A Google Search ad targets users on search result pages, targeting based on user behavior.

Google Search ads target users based on specific search queries and browsing behaviors, offering tailored messaging that aligns with user intent. This precise targeting tends to yield higher cost per click, quality impressions, and conversions, as ads are more relevant to users actively interested in John Deere, agriculture, tractors, golf equipment, construction, etc.

Impressions
0
Number of times an ad is displayed on Google or the Google Network
Clicks
0
Number of times an ad is
clicked by users
Conversions
0

An action by a user after clicking an ad, such filling out a form.

Note: Conversion actions can be defined individually per ad.

Cost Per Click
$ 0
Amount paid each time a user clicks on an ad
Monthly Cost
$ 0

Before Co-Op

Monthly Cost
$ 0

After Co-Op

Average PMax Ad Performance - Per Store

A Google PMax ad, or Performance Max campaign, is a type of advertising that automatically optimizes ad placement across all Google platforms, including Search, Display, YouTube, and more, based on specific performance goals.

Google PMax ads automate ad placements across all Google platforms (including Search, Display, YouTube, Gmail, and more) based on performance goals but without the granular control over context and placement. While PMax campaigns to optimize outcomes with a lower cost-per-click, they might not match the intent-driven engagement of ads.

Impressions
0
Number of times an ad is displayed on Google or the Google Network
Clicks
0
number of times an ad is
clicked by users
Conversions
0

An action by a user after clicking an ad, such filling out a form.

Cost Per Click
$ 0
Amount paid each time a user clicks on an ad
Monthly Cost
$ 0

Before Co-Op

Monthly Cost
$ 0

After Co-Op

Average Google Ad Conversions - Per Store

These metrics show the number of Google Ads served to users based on proximity to their local Stotz Equipment and the actions taken by users as a direct result of the ad. These are the average results of local ads across all Google platforms, per store.     

Local Impressions
0

The number of times a location-based ad was shown

Store Visits
0

Number of times people visited a store in-person after clicking a local ad

Call Clicks

Number of times people clicked the Call button during or after clicking a local ad

Driving Directions
0

Number of times people clicked Get directions after clicking a local ad

Website Visits
0

Number of times people were taken to a store’s location page on stotzequipment.com after clicking a local ad

Facebook

Facebook ads target users based on their profile information, preferences, and online activity, displaying tailored advertisements across all of Meta’s network which includes Facebook, Instagram, Messenger, and the Audience Network, to meet specific marketing objectives.

Meta targets users for Facebook Ads by analyzing extensive data on user activities and preferences across its platforms. This includes demographic information, user interactions, and behaviors such as likes, shares, and comments. Ads are then personalized and shown to users based on their past online activities, interests, and the likelihood of engaging with specific content, ensuring that advertisers can reach highly specific audiences likely to be interested in their products or services.

Average CUT Ad Performance - Per Store

Impressions
0
The number of times an ad is displayed across any of Meta’s platforms
Clicks
0
The total number of interactions where users click on an ad within Meta’s platforms
Cost Per Click
$ 0
The average cost paid for each click on an ad across all of Meta’s platforms
Monthly Cost
$ 0

Before Co-Op

Monthly Cost
$ 0

After Co-Op

Average CCE Ad Performance - Per Store

Impressions
0
The number of times an ad is displayed across any of Meta’s platforms
Clicks
0
The total number of interactions where users click on an ad within Meta’s platforms
Cost Per Click
$ 0
The average cost paid for each click on an ad across all of Meta’s platforms
Monthly Cost
$ 0

Before Co-Op

Monthly Cost
$ 0

After Co-Op

Average Mid Ag & Hay Ad Performance - Per Store

Impressions
0
The number of times an ad is displayed across any of Meta’s platforms
Clicks
0
The total number of interactions where users click on an ad within Meta’s platforms
Cost Per Click
$ 0
The average cost paid for each click on an ad across all of Meta’s platforms
Monthly Cost
$ 0

Before Co-Op

Monthly Cost
$ 0

After Co-Op

Lean Media

Lean Media collaborates with advertisers to plan, design, execute, and measure digital ad campaigns, using programmatic buying to target precise audiences across devices and platforms.

Third-Party Hay & Forage Ads

Impressions
0

Number of times an ad is displayed to potential viewers on various platforms within Lean Media’s network

Clicks
0

Number of times users actually click on an ad, indicating engagement or interest

Click Through Rate
0 %

Measures the percentage of impressions that resulted in a click, providing insight into the ad’s effectiveness

Conversions
0

Number of actions taken by users after clicking the ad, such as making a purchase or signing up, which aligns with the campaign’s goals

Third-Party Livestock Ads

Impressions
0

Number of times an ad is displayed to potential viewers on various platforms within Lean Media’s network

Clicks
0

Number of times users actually click on an ad, indicating engagement or interest

Click Through Rate
0 %

Measures the percentage of impressions that resulted in a click, providing insight into the ad’s effectiveness

Conversions
0

Number of actions taken by users after clicking the ad, such as making a purchase or signing up, which aligns with the campaign’s goals

Search Retargeting

Search Retargeting involves targeting users who have previously searched for keywords or phrases related to your products or services, even if they have not visited your website.

Impressions
0

Number of times an ad is displayed to potential viewers on various platforms within Lean Media’s network

Clicks
0

Number of times users actually click on an ad, indicating engagement or interest

Click Through Rate
0 %

Measures the percentage of impressions that resulted in a click, providing insight into the ad’s effectiveness

Conversions
0

Number of actions taken by users after clicking the ad, such as making a purchase or signing up, which aligns with the campaign’s goals

Site Retargeting

Site Retargeting targets users who have previously visited your website, displaying relevant ads to them as they browse other sites, to encourage them to return and complete a purchase or another desired action.
Impressions
0

Number of times an ad is displayed to potential viewers on various platforms within Lean Media’s network

Clicks
0

Number of times users actually click on an ad, indicating engagement or interest

Click Through Rate
0 %

Measures the percentage of impressions that resulted in a click, providing insight into the ad’s effectiveness

Conversions
0

Number of actions taken by users after clicking the ad, such as making a purchase or signing up, which aligns with the campaign’s goals

Google Analytics

Web analytics service offered by Google that tracks and reports website traffic, providing insights into user behavior, engagement, and conversion metrics.

Site Visitors
0
A website visitor refers to an individual who interacts with your website during a specific time frame
First-time Site Visitors
0

Each visitor is tracked through a unique identifier, allowing the system to distinguish between new and returning visitors

Average Time Spent on Site
0 s

Total duration that a visitor stays on your website
during a single session

User Acquisition

Where are website visitors coming from? How are they finding out about www.stotzequipment.com?
FB Audience Network - Paid
10.6K
Google - Cost-per-click
7.3K
Google - Organic
6.9K
Facebook - Paid
6K
Direct Traffic
4.6K
Bing - Organic
633
Instagram - Paid
563
Deere.com
444

Top Pages

Theses are the pages that receive the most visits within a given time frame. This metric provides insights into which parts of the website are most engaging or popular, as well as a correlation to relative ad campaigns across all platforms.

CUTs
26.5
Locations
10.3K
Used Equipment
8K
CCE
3.4K
Mid Size Ag & Hay
3K
Shop.Deere Landing Page
1.7K
Current Openings
1.6K

Digital Sales Leads

stotzequipment.com

These metrics reflect the request-a-quote form submissions from our website.

Request a Quote Leads
0
Request-a-quote leads are generated when users fill out a form expressing interest on a specific equipment web page.
Consumer Products
55
Ag
6
CCE
12
Golf & Turf
19
CUTs
33

John Deere Certified Digital Program (JDCDP)

John Deere | Shift Digital

The John Deere Certified Digital Program/Digital Health Check evaluates the follow up to digital sales leads, online customer experience, and other points of customer engagement for the Sales and Service departments at each store. Reports are published monthly in the JDCDP dashboard.

Average Response Percentage to Customer Inquiries - Per Store

John Deere’s Goal is 75%

Phone Sales
0 %

Response to sales inquiries made over the phone. These scores are measured by test calls made by John Deere/Shift digital.

Phone Service
0 %

Response to service requests made over the phone. These scores are measured by test calls made by John Deere/Shift digital.

Average Response to Digital Sales Leads - Digital Sales (Corp) Dept.

John Deere’s Goal is that 75% of digital sales leads are followed up on, that email response times are less than 60min, and phone call/text response times are less than 30min.

Digital Sales Leads
0 %

Response to request-a-quote/sales leads on whole goods made through the website. John Deere goal is 75%.

Phone Leads
0 min

Response time to digital sales leads made over the phone. John Deere goal is less than 60min.
E-mail Leads
0 min

Response time to digital sales leads made via email. John Deere goal is less than 30min.

Looking for More?

Posted on

Monthly Reports | August 2024

Monthly Digital Advertising Results | August 2024

For more in-depth data, custom reports, or specific metrics, please contact [email protected] 

Note: The Marketing and Data Teams are currently developing a Digital Advertising Power BI dashboard to enhance monthly reporting and increase leverage.

Google Business

Average Performance of Google Business Metrics - Per Store

Google Business Profile reporting metrics primarily track how customers interact with your business listing on Google, for each Stotz Equipment location. These metrics help you understand customer behavior and optimize your business’s visibility on Google.

Calls
0

Number of times the Call
link was clicked

Directions
0

Number of times the Directions
link was clicked

Website Clicks
0

Number of times the Website
link was clicked

Overall Rating
0
Average star rating based
on reviews

Average Number of Google Searches - Per Store

Searches made using the standard Google Search tool or the using the URL bar in Google Chrome. These results are shown under the “All” tab in Google.
Mobile
1767
Desktop
712

Average number of Google Maps searches - Per Store

Searches for locations in Google Maps. Mobile results include searches both in the Google Maps App and under the “Maps” tab in a mobile web browser.

Mobile
8345
Desktop
614

Google Ads

Average Search Ad Performance - Per Store

A Google Search ad targets users on search result pages, targeting based on user behavior.

Google Search ads target users based on specific search queries and browsing behaviors, offering tailored messaging that aligns with user intent. This precise targeting tends to yield higher cost per click, quality impressions, and conversions, as ads are more relevant to users actively interested in John Deere, agriculture, tractors, golf equipment, construction, etc.

Impressions
0
Number of times an ad is displayed on Google or the Google Network
Clicks
0
Number of times an ad is
clicked by users
Conversions
0

An action by a user after clicking an ad, such filling out a form.

Note: Conversion actions can be defined individually per ad.

Cost Per Click
$ 0
Amount paid each time a user clicks on an ad
Monthly Cost
$ 0

Before Co-Op

Monthly Cost
$ 0

After Co-Op

Average PMax Ad Performance - Per Store

A Google PMax ad, or Performance Max campaign, is a type of advertising that automatically optimizes ad placement across all Google platforms, including Search, Display, YouTube, and more, based on specific performance goals.

Google PMax ads automate ad placements across all Google platforms (including Search, Display, YouTube, Gmail, and more) based on performance goals but without the granular control over context and placement. While PMax campaigns to optimize outcomes with a lower cost-per-click, they might not match the intent-driven engagement of ads.

Impressions
0
Number of times an ad is displayed on Google or the Google Network
Clicks
0
number of times an ad is
clicked by users
Conversions
0

An action by a user after clicking an ad, such filling out a form.

Cost Per Click
$ 0
Amount paid each time a user clicks on an ad
Monthly Cost
$ 0

Before Co-Op

Monthly Cost
$ 0

After Co-Op

Average Google Ad Conversions - Per Store

These metrics show the number of Google Ads served to users based on proximity to their local Stotz Equipment and the actions taken by users as a direct result of the ad. These are the average results of local ads across all Google platforms, per store.     

Local Impressions
0

The number of times a location-based ad was shown

Store Visits
0

Number of times people visited a store in-person after clicking a local ad

Call Clicks

Number of times people clicked the Call button during or after clicking a local ad

Driving Directions
0

Number of times people clicked Get directions after clicking a local ad

Website Visits
0

Number of times people were taken to a store’s location page on stotzequipment.com after clicking a local ad

Facebook

Facebook ads target users based on their profile information, preferences, and online activity, displaying tailored advertisements across all of Meta’s network which includes Facebook, Instagram, Messenger, and the Audience Network, to meet specific marketing objectives.

Meta targets users for Facebook Ads by analyzing extensive data on user activities and preferences across its platforms. This includes demographic information, user interactions, and behaviors such as likes, shares, and comments. Ads are then personalized and shown to users based on their past online activities, interests, and the likelihood of engaging with specific content, ensuring that advertisers can reach highly specific audiences likely to be interested in their products or services.

Average CUT Ad Performance - Per Store

Impressions
0
The number of times an ad is displayed across any of Meta’s platforms
Clicks
0
The total number of interactions where users click on an ad within Meta’s platforms
Cost Per Click
$ 0
The average cost paid for each click on an ad across all of Meta’s platforms
Monthly Cost
$ 0

Before Co-Op

Monthly Cost
$ 0

After Co-Op

Average CCE Ad Performance - Per Store

Impressions
0
The number of times an ad is displayed across any of Meta’s platforms
Clicks
0
The total number of interactions where users click on an ad within Meta’s platforms
Cost Per Click
$ 0
The average cost paid for each click on an ad across all of Meta’s platforms
Monthly Cost
$ 0

Before Co-Op

Monthly Cost
$ 0

After Co-Op

Average Mid Ag & Hay Ad Performance - Per Store

Impressions
0
The number of times an ad is displayed across any of Meta’s platforms
Clicks
0
The total number of interactions where users click on an ad within Meta’s platforms
Cost Per Click
$ 0
The average cost paid for each click on an ad across all of Meta’s platforms
Monthly Cost
$ 0

Before Co-Op

Monthly Cost
$ 0

After Co-Op

Lean Media

Lean Media collaborates with advertisers to plan, design, execute, and measure digital ad campaigns, using programmatic buying to target precise audiences across devices and platforms.

Third-Party Hay & Forage Ads

Impressions
0

Number of times an ad is displayed to potential viewers on various platforms within Lean Media’s network

Clicks
0

Number of times users actually click on an ad, indicating engagement or interest

Click Through Rate
0 %

Measures the percentage of impressions that resulted in a click, providing insight into the ad’s effectiveness

Conversions
0

Number of actions taken by users after clicking the ad, such as making a purchase or signing up, which aligns with the campaign’s goals

Third-Party Livestock Ads

Impressions
0

Number of times an ad is displayed to potential viewers on various platforms within Lean Media’s network

Clicks
0

Number of times users actually click on an ad, indicating engagement or interest

Click Through Rate
0 %

Measures the percentage of impressions that resulted in a click, providing insight into the ad’s effectiveness

Conversions
0

Number of actions taken by users after clicking the ad, such as making a purchase or signing up, which aligns with the campaign’s goals

Search Retargeting

Search Retargeting involves targeting users who have previously searched for keywords or phrases related to your products or services, even if they have not visited your website.

Impressions
0

Number of times an ad is displayed to potential viewers on various platforms within Lean Media’s network

Clicks
0

Number of times users actually click on an ad, indicating engagement or interest

Click Through Rate
0 %

Measures the percentage of impressions that resulted in a click, providing insight into the ad’s effectiveness

Conversions
0

Number of actions taken by users after clicking the ad, such as making a purchase or signing up, which aligns with the campaign’s goals

Site Retargeting

Site Retargeting targets users who have previously visited your website, displaying relevant ads to them as they browse other sites, to encourage them to return and complete a purchase or another desired action.
Impressions
0

Number of times an ad is displayed to potential viewers on various platforms within Lean Media’s network

Clicks
0

Number of times users actually click on an ad, indicating engagement or interest

Click Through Rate
0 %

Measures the percentage of impressions that resulted in a click, providing insight into the ad’s effectiveness

Conversions
0

Number of actions taken by users after clicking the ad, such as making a purchase or signing up, which aligns with the campaign’s goals

Google Analytics

Web analytics service offered by Google that tracks and reports website traffic, providing insights into user behavior, engagement, and conversion metrics.

Site Visitors
0
A website visitor refers to an individual who interacts with your website during a specific time frame
First-time Site Visitors
0

Each visitor is tracked through a unique identifier, allowing the system to distinguish between new and returning visitors

Average Time Spent on Site
0 s

Total duration that a visitor stays on your website
during a single session

User Acquisition

Where are website visitors coming from? How are they finding out about www.stotzequipment.com?
Facebook - Paid
11.7K
Google - Organic
11.1K
Google - Cost-per-click
9K
Direct Traffic
7.6K
Instagram - Paid
5.8K
FB Audience Network - Paid
4.3K
Bing - Organic
1.1K
Deere.com
652

Top Pages

Theses are the pages that receive the most visits within a given time frame. This metric provides insights into which parts of the website are most engaging or popular, as well as a correlation to relative ad campaigns across all platforms.

CUTs
21.6K
Used Equipment
9.1K
CCE
9K
Locations
7K
Home Page
6.7K
Mid Size Ag & Hay
3.1K
Shop.Deere Landing Page
2.2K
Current Openings
1.9K
New Equipment
1.7K

Digital Sales Leads

stotzequipment.com

These metrics reflect the request-a-quote form submissions from our website.

Request a Quote Leads
0
Request-a-quote leads are generated when users fill out a form expressing interest on a specific equipment web page.
Consumer Products
41
Ag
18
CCE
12
Golf & Turf
13
CUTs
52

John Deere Certified Digital Program (JDCDP)

John Deere | Shift Digital

The John Deere Certified Digital Program/Digital Health Check evaluates the follow up to digital sales leads, online customer experience, and other points of customer engagement for the Sales and Service departments at each store. Reports are published monthly in the JDCDP dashboard.

Average Response Percentage to Customer Inquiries - Per Store

John Deere’s Goal is 75%

Phone Sales
0 %

Response to sales inquiries made over the phone. These scores are measured by test calls made by John Deere/Shift digital.

Phone Service
0 %

Response to service requests made over the phone. These scores are measured by test calls made by John Deere/Shift digital.

Average Response to Digital Sales Leads - Digital Sales (Corp) Dept.

John Deere’s Goal is that 75% of digital sales leads are followed up on, that email response times are less than 60min, and phone call/text response times are less than 30min.

Digital Sales Leads
0 %

Response to request-a-quote/sales leads on whole goods made through the website. John Deere goal is 75%.

Phone Leads
0 min

Response time to digital sales leads made over the phone. John Deere goal is less than 60min.
E-mail Leads
0 min

Response time to digital sales leads made via email. John Deere goal is less than 30min.

Looking for More?

Posted on

Monthly Reports | July 2024

Monthly Digital Advertising Results | July 2024

For more in-depth data, custom reports, or specific metrics, please contact [email protected] 

Note: The Marketing and Data Teams are currently developing a Digital Advertising Power BI dashboard to enhance monthly reporting and increase leverage.

Google Business

Average Performance of Google Business Metrics - Per Store

Google Business Profile reporting metrics primarily track how customers interact with your business listing on Google, for each Stotz Equipment location. These metrics help you understand customer behavior and optimize your business’s visibility on Google.

Calls
0

Number of times the Call
link was clicked

Directions
0

Number of times the Directions
link was clicked

Website Clicks
0

Number of times the Website
link was clicked

Overall Rating
0
Average star rating based
on reviews

Average Number of Google Searches - Per Store

Searches made using the standard Google Search tool or the using the URL bar in Google Chrome. These results are shown under the “All” tab in Google.
Mobile
1624
Desktop
623

Average number of Google Maps searches - Per Store

Searches for locations in Google Maps. Mobile results include searches both in the Google Maps App and under the “Maps” tab in a mobile web browser.

Mobile
8839
Desktop
603

Google Ads

Average Search Ad Performance - Per Store

A Google Search ad targets users on search result pages, targeting based on user behavior.

Google Search ads target users based on specific search queries and browsing behaviors, offering tailored messaging that aligns with user intent. This precise targeting tends to yield higher cost per click, quality impressions, and conversions, as ads are more relevant to users actively interested in John Deere, agriculture, tractors, golf equipment, construction, etc.

Impressions
0
Number of times an ad is displayed on Google or the Google Network
Clicks
0
Number of times an ad is
clicked by users
Conversions
0

An action by a user after clicking an ad, such filling out a form.

Note: Conversion actions can be defined individually per ad.

Cost Per Click
$ 0
Amount paid each time a user clicks on an ad
Monthly Cost
$ 0

Before Co-Op

Monthly Cost
$ 0

After Co-Op

Average PMax Ad Performance - Per Store

A Google PMax ad, or Performance Max campaign, is a type of advertising that automatically optimizes ad placement across all Google platforms, including Search, Display, YouTube, and more, based on specific performance goals.

Google PMax ads automate ad placements across all Google platforms (including Search, Display, YouTube, Gmail, and more) based on performance goals but without the granular control over context and placement. While PMax campaigns to optimize outcomes with a lower cost-per-click, they might not match the intent-driven engagement of ads.

Impressions
0
Number of times an ad is displayed on Google or the Google Network
Clicks
0
number of times an ad is
clicked by users
Conversions
0

An action by a user after clicking an ad, such filling out a form.

Cost Per Click
$ 0
Amount paid each time a user clicks on an ad
Monthly Cost
$ 0

Before Co-Op

Monthly Cost
$ 0

After Co-Op

Average Google Ad Conversions - Per Store

These metrics show the number of Google Ads served to users based on proximity to their local Stotz Equipment and the actions taken by users as a direct result of the ad. These are the average results of local ads across all Google platforms, per store.     

Local Impressions
0

The number of times a location-based ad was shown

Store Visits
0

Number of times people visited a store in-person after clicking a local ad

Call Clicks

Number of times people clicked the Call button during or after clicking a local ad

Driving Directions
0

Number of times people clicked Get directions after clicking a local ad

Website Visits
0

Number of times people were taken to a store’s location page on stotzequipment.com after clicking a local ad

Facebook

Facebook ads target users based on their profile information, preferences, and online activity, displaying tailored advertisements across all of Meta’s network which includes Facebook, Instagram, Messenger, and the Audience Network, to meet specific marketing objectives.

Meta targets users for Facebook Ads by analyzing extensive data on user activities and preferences across its platforms. This includes demographic information, user interactions, and behaviors such as likes, shares, and comments. Ads are then personalized and shown to users based on their past online activities, interests, and the likelihood of engaging with specific content, ensuring that advertisers can reach highly specific audiences likely to be interested in their products or services.

Average CUT Ad Performance - Per Store

Impressions
0
The number of times an ad is displayed across any of Meta’s platforms
Clicks
0
The total number of interactions where users click on an ad within Meta’s platforms
Cost Per Click
$ 0
The average cost paid for each click on an ad across all of Meta’s platforms
Monthly Cost
$ 0

Before Co-Op

Monthly Cost
$ 0

After Co-Op

Average CCE Ad Performance - Per Store

Impressions
0
The number of times an ad is displayed across any of Meta’s platforms
Clicks
0
The total number of interactions where users click on an ad within Meta’s platforms
Cost Per Click
$ 0
The average cost paid for each click on an ad across all of Meta’s platforms
Monthly Cost
$ 0

Before Co-Op

Monthly Cost
$ 0

After Co-Op

Average Mid Ag & Hay Ad Performance - Per Store

Impressions
0
The number of times an ad is displayed across any of Meta’s platforms
Clicks
0
The total number of interactions where users click on an ad within Meta’s platforms
Cost Per Click
$ 0
The average cost paid for each click on an ad across all of Meta’s platforms
Monthly Cost
$ 0

Before Co-Op

Monthly Cost
$ 0

After Co-Op

Lean Media

Lean Media collaborates with advertisers to plan, design, execute, and measure digital ad campaigns, using programmatic buying to target precise audiences across devices and platforms.

Third-Party Hay & Forage Ads

Impressions
0

Number of times an ad is displayed to potential viewers on various platforms within Lean Media’s network

Clicks
0

Number of times users actually click on an ad, indicating engagement or interest

Click Through Rate
0 %

Measures the percentage of impressions that resulted in a click, providing insight into the ad’s effectiveness

Conversions
0

Number of actions taken by users after clicking the ad, such as making a purchase or signing up, which aligns with the campaign’s goals

Third-Party Livestock Ads

Impressions
0

Number of times an ad is displayed to potential viewers on various platforms within Lean Media’s network

Clicks
0

Number of times users actually click on an ad, indicating engagement or interest

Click Through Rate
0 %

Measures the percentage of impressions that resulted in a click, providing insight into the ad’s effectiveness

Conversions
0

Number of actions taken by users after clicking the ad, such as making a purchase or signing up, which aligns with the campaign’s goals

Search Retargeting

Search Retargeting involves targeting users who have previously searched for keywords or phrases related to your products or services, even if they have not visited your website.

Impressions
0

Number of times an ad is displayed to potential viewers on various platforms within Lean Media’s network

Clicks
0

Number of times users actually click on an ad, indicating engagement or interest

Click Through Rate
0 %

Measures the percentage of impressions that resulted in a click, providing insight into the ad’s effectiveness

Conversions
0

Number of actions taken by users after clicking the ad, such as making a purchase or signing up, which aligns with the campaign’s goals

Site Retargeting

Site Retargeting targets users who have previously visited your website, displaying relevant ads to them as they browse other sites, to encourage them to return and complete a purchase or another desired action.
Impressions
0

Number of times an ad is displayed to potential viewers on various platforms within Lean Media’s network

Clicks
0

Number of times users actually click on an ad, indicating engagement or interest

Click Through Rate
0 %

Measures the percentage of impressions that resulted in a click, providing insight into the ad’s effectiveness

Conversions
0

Number of actions taken by users after clicking the ad, such as making a purchase or signing up, which aligns with the campaign’s goals

Google Analytics

Web analytics service offered by Google that tracks and reports website traffic, providing insights into user behavior, engagement, and conversion metrics.

Site Visitors
0
A website visitor refers to an individual who interacts with your website during a specific time frame
First-time Site Visitors
0

Each visitor is tracked through a unique identifier, allowing the system to distinguish between new and returning visitors

Average Time Spent on Site
0 s

Total duration that a visitor stays on your website
during a single session

User Acquisition

Where are website visitors coming from? How are they finding out about www.stotzequipment.com?
Facebook - Paid
9.8K
Instagram - Paid
8.6K
Google - Cost-per-click
8.5K
Google - Organic
7.8K
Direct Traffic
4.2K
Bing - Organic
603
Deere.com
460

Top Pages

Theses are the pages that receive the most visits within a given time frame. This metric provides insights into which parts of the website are most engaging or popular, as well as a correlation to relative ad campaigns across all platforms.

CUTs
13.9K
Home Page
10.8K
CCE
9.3K
Test Drive Tractor Sweepstakes
7.4K
Mid Size Ag & Hay
3.3K
Used Equipment
2.9K
Shop.Deere Landing Page
2K
Used Tractors
1.9K
Current Openings
1.8K
Locations
1.8K

Digital Sales Leads

stotzequipment.com

These metrics reflect the request-a-quote form submissions from our website.

Request a Quote Leads
0
Request-a-quote leads are generated when users fill out a form expressing interest on a specific equipment web page.
Consumer Products
42
Ag
20
CCE
14
Golf & Turf
15
CUTs
53

John Deere Certified Digital Program (JDCDP)

John Deere | Shift Digital

The John Deere Certified Digital Program/Digital Health Check evaluates the follow up to digital sales leads, online customer experience, and other points of customer engagement for the Sales and Service departments at each store. Reports are published monthly in the JDCDP dashboard.

Average Response Percentage to Customer Inquiries - Per Store

John Deere’s Goal is 75%

Phone Sales
0 %

Response to sales inquiries made over the phone. These scores are measured by test calls made by John Deere/Shift digital.

Phone Service
0 %

Response to service requests made over the phone. These scores are measured by test calls made by John Deere/Shift digital.

Online Service
0 %

Response to service requests made through stotzequipment.com. These scores are measured by test submissions made by John Deere/Shift digital.

Average Response to Digital Sales Leads - Digital Sales (Corp) Dept.

John Deere’s Goal is that 75% of digital sales leads are followed up on, that email response times are less than 60min, and phone call/text response times are less than 30min.

Digital Sales Leads
0 %

Response to request-a-quote/sales leads on whole goods made through the website. John Deere goal is 75%.

Phone Leads
0 min

Response time to digital sales leads made over the phone. John Deere goal is less than 60min.
E-mail Leads
0 min

Response time to digital sales leads made via email. John Deere goal is less than 30min.

Looking for More?

Posted on

Monthly Reports | June 2024

Monthly Digital Advertising Results | June 2024

For more in-depth data, custom reports, or specific metrics, please contact [email protected] 

Note: The Marketing and Data Teams are currently developing a Digital Advertising Power BI dashboard to enhance monthly reporting and increase leverage.

Google Business

Average Performance of Google Business Metrics - Per Store

Google Business Profile reporting metrics primarily track how customers interact with your business listing on Google, for each Stotz Equipment location. These metrics help you understand customer behavior and optimize your business’s visibility on Google.

Calls
0

Number of times the Call
link was clicked

Directions
0

Number of times the Directions
link was clicked

Website Clicks
0

Number of times the Website
link was clicked

Overall Rating
0
Average star rating based
on reviews

Average Number of Google Searches - Per Store

Searches made using the standard Google Search tool or the using the URL bar in Google Chrome. These results are shown under the “All” tab in Google.
Mobile
1542
Desktop
569

Average number of Google Maps searches - Per Store

Searches for locations in Google Maps. Mobile results include searches both in the Google Maps App and under the “Maps” tab in a mobile web browser.

Mobile
8525
Desktop
599

Google Ads

Average Search Ad Performance - Per Store

A Google Search ad targets users on search result pages, targeting based on user behavior.

Google Search ads target users based on specific search queries and browsing behaviors, offering tailored messaging that aligns with user intent. This precise targeting tends to yield higher cost per click, quality impressions, and conversions, as ads are more relevant to users actively interested in John Deere, agriculture, tractors, golf equipment, construction, etc.

Impressions
0
Number of times an ad is displayed on Google or the Google Network
Clicks
0
Number of times an ad is
clicked by users
Conversions
0

An action by a user after clicking an ad, such filling out a form.

Note: Conversion actions can be defined individually per ad.

Cost Per Click
$ 0
Amount paid each time a user clicks on an ad
Monthly Cost
$ 0

Before Co-Op

Monthly Cost
$ 0

After Co-Op

Average PMax Ad Performance - Per Store

A Google PMax ad, or Performance Max campaign, is a type of advertising that automatically optimizes ad placement across all Google platforms, including Search, Display, YouTube, and more, based on specific performance goals.

Google PMax ads automate ad placements across all Google platforms (including Search, Display, YouTube, Gmail, and more) based on performance goals but without the granular control over context and placement. While PMax campaigns to optimize outcomes with a lower cost-per-click, they might not match the intent-driven engagement of ads.

Impressions
0
Number of times an ad is displayed on Google or the Google Network
Clicks
0
number of times an ad is
clicked by users
Conversions
0

An action by a user after clicking an ad, such filling out a form.

Cost Per Click
$ 0
Amount paid each time a user clicks on an ad
Monthly Cost
$ 0

Before Co-Op

Monthly Cost
$ 0

After Co-Op

Average Google Ad Conversions - Per Store

These metrics show the number of Google Ads served to users based on proximity to their local Stotz Equipment and the actions taken by users as a direct result of the ad. These are the average results of local ads across all Google platforms, per store.     

Local Impressions
0

The number of times a location-based ad was shown

Store Visits
0

Number of times people visited a store in-person after clicking a local ad

Call Clicks

Number of times people clicked the Call button during or after clicking a local ad

Driving Directions
0

Number of times people clicked Get directions after clicking a local ad

Website Visits
0

Number of times people were taken to a store’s location page on stotzequipment.com after clicking a local ad

Facebook

Facebook ads target users based on their profile information, preferences, and online activity, displaying tailored advertisements across all of Meta’s network which includes Facebook, Instagram, Messenger, and the Audience Network, to meet specific marketing objectives.

Meta targets users for Facebook Ads by analyzing extensive data on user activities and preferences across its platforms. This includes demographic information, user interactions, and behaviors such as likes, shares, and comments. Ads are then personalized and shown to users based on their past online activities, interests, and the likelihood of engaging with specific content, ensuring that advertisers can reach highly specific audiences likely to be interested in their products or services.

Average CUT Ad Performance - Per Store

Impressions
0
The number of times an ad is displayed across any of Meta’s platforms
Clicks
0
The total number of interactions where users click on an ad within Meta’s platforms
Cost Per Click
$ 0
The average cost paid for each click on an ad across all of Meta’s platforms
Monthly Cost
$ 0

Before Co-Op

Monthly Cost
$ 0

After Co-Op

Average CCE Ad Performance - Per Store

Impressions
0
The number of times an ad is displayed across any of Meta’s platforms
Clicks
0
The total number of interactions where users click on an ad within Meta’s platforms
Cost Per Click
$ 0
The average cost paid for each click on an ad across all of Meta’s platforms
Monthly Cost
$ 0

Before Co-Op

Monthly Cost
$ 0

After Co-Op

Average Mid Ag & Hay Ad Performance - Per Store

Impressions
0
The number of times an ad is displayed across any of Meta’s platforms
Clicks
0
The total number of interactions where users click on an ad within Meta’s platforms
Cost Per Click
$ 0
The average cost paid for each click on an ad across all of Meta’s platforms
Monthly Cost
$ 0

Before Co-Op

Monthly Cost
$ 0

After Co-Op

Lean Media

Lean Media collaborates with advertisers to plan, design, execute, and measure digital ad campaigns, using programmatic buying to target precise audiences across devices and platforms.

Third-Party Hay & Forage Ads

Impressions
0

Number of times an ad is displayed to potential viewers on various platforms within Lean Media’s network

Clicks
0

Number of times users actually click on an ad, indicating engagement or interest

Click Through Rate
0 %

Measures the percentage of impressions that resulted in a click, providing insight into the ad’s effectiveness

Conversions
0

Number of actions taken by users after clicking the ad, such as making a purchase or signing up, which aligns with the campaign’s goals

Third-Party Livestock Ads

Impressions
0

Number of times an ad is displayed to potential viewers on various platforms within Lean Media’s network

Clicks
0

Number of times users actually click on an ad, indicating engagement or interest

Click Through Rate
0 %

Measures the percentage of impressions that resulted in a click, providing insight into the ad’s effectiveness

Conversions
0

Number of actions taken by users after clicking the ad, such as making a purchase or signing up, which aligns with the campaign’s goals

Search Retargeting

Search Retargeting involves targeting users who have previously searched for keywords or phrases related to your products or services, even if they have not visited your website.

Impressions
0

Number of times an ad is displayed to potential viewers on various platforms within Lean Media’s network

Clicks
0

Number of times users actually click on an ad, indicating engagement or interest

Click Through Rate
0 %

Measures the percentage of impressions that resulted in a click, providing insight into the ad’s effectiveness

Conversions
0

Number of actions taken by users after clicking the ad, such as making a purchase or signing up, which aligns with the campaign’s goals

Site Retargeting

Site Retargeting targets users who have previously visited your website, displaying relevant ads to them as they browse other sites, to encourage them to return and complete a purchase or another desired action.
Impressions
0

Number of times an ad is displayed to potential viewers on various platforms within Lean Media’s network

Clicks
0

Number of times users actually click on an ad, indicating engagement or interest

Click Through Rate
0 %

Measures the percentage of impressions that resulted in a click, providing insight into the ad’s effectiveness

Conversions
0

Number of actions taken by users after clicking the ad, such as making a purchase or signing up, which aligns with the campaign’s goals

Google Analytics

Web analytics service offered by Google that tracks and reports website traffic, providing insights into user behavior, engagement, and conversion metrics.

Site Visitors
0
A website visitor refers to an individual who interacts with your website during a specific time frame
First-time Site Visitors
0

Each visitor is tracked through a unique identifier, allowing the system to distinguish between new and returning visitors

Average Time Spent on Site
0 s

Total duration that a visitor stays on your website
during a single session

User Acquisition

Where are website visitors coming from? How are they finding out about www.stotzequipment.com?
Instagram - Paid
10.5K
Google - Cost-per-click
10K
Google - Organic
8.6K
Facebook - Paid
8.2K
Direct Traffic
4.5K
Bing - Organic
644
Deere.com
597

Top Pages

Theses are the pages that receive the most visits within a given time frame. This metric provides insights into which parts of the website are most engaging or popular, as well as a correlation to relative ad campaigns across all platforms.

CUTs
14.8K
Home Page
12.2K
Used Equipment
8.8K
Test Drive Tractor Sweepstakes
8.6K
CCE
8K
Mid Size Ag & Hay
3.4K
Locations
2.1K
New Equipment
2K
Shop.Deere Landing Page
1.9K
Current Openings
1.9K

Digital Sales Leads

stotzequipment.com

These metrics reflect the request-a-quote form submissions from our website.

Request a Quote Leads
0
Request-a-quote leads are generated when users fill out a form expressing interest on a specific equipment web page.
Consumer Products
50
Ag
16
CCE
7
Golf & Turf
14
CUTs
49

Data for June 2024 has not yet been published by John Deere. Expected publication date is 07/15/2024

John Deere Certified Digital Program (JDCDP)

John Deere | Shift Digital

The John Deere Certified Digital Program/Digital Health Check evaluates the follow up to digital sales leads, online customer experience, and other points of customer engagement for the Sales and Service departments at each store. Reports are published monthly in the JDCDP dashboard.

Average Response Percentage to Customer Inquiries - Per Store

John Deere’s Goal is 75%

Phone Sales
0 %

Response to sales inquiries made over the phone. These scores are measured by test calls made by John Deere/Shift digital.

Phone Service
0 %

Response to service requests made over the phone. These scores are measured by test calls made by John Deere/Shift digital.

Online Service
0 %

Response to service requests made through stotzequipment.com. These scores are measured by test submissions made by John Deere/Shift digital.

Average Response to Digital Sales Leads - Digital Sales (Corp) Dept.

John Deere’s Goal is that 75% of digital sales leads are followed up on, that email response times are less than 60min, and phone call/text response times are less than 30min.

Digital Sales Leads
0 %

Response to request-a-quote/sales leads on whole goods made through the website. John Deere goal is 75%.

Phone Leads
0 min

Response time to digital sales leads made over the phone. John Deere goal is less than 60min.
E-mail Leads
0 min

Response time to digital sales leads made via email. John Deere goal is less than 30min.

Looking for More?

Posted on

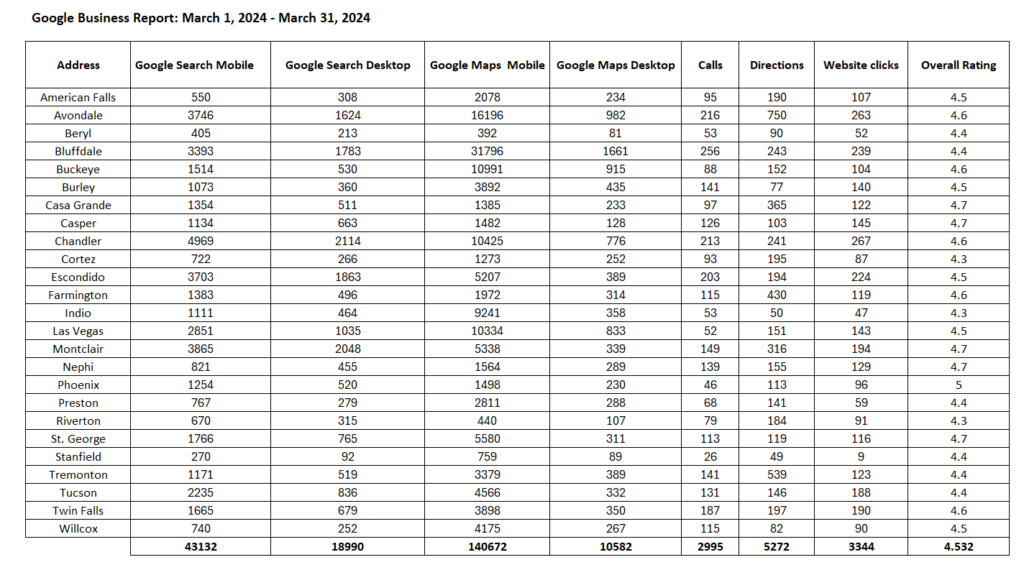
Monthly Reports | March 2024

Monthly Digital Advertising Results | March 2024

Google Business

Here are the Google Business reports:

Overall Rating: Overall rating of this listing as of the date the report was generated

Total Searches: Number of times customers found this listing by searching on Google Search or Maps

Direct Searches: Number of times customers found this listing by searching for the business name or address on Google Search or Maps

Discovery Searches: Number of times customers found this listing by searching for the category, product or service on Google Search or Maps

Total Views: Number of times this listing has been viewed on Google Search or Maps

Search Views: Number of times this listing has been viewed on Google Search

Map Views: Number of times this listing has been viewed on Google Maps

Total Actions: Number of times customers have taken action on this listing on Google Search or Maps

Website Actions: Number of times customers have visited the website from this listing

Directions Actions: Number of times customers have requested directions from this listing

Phone Call Actions: Number of times customers have called the business from this listing

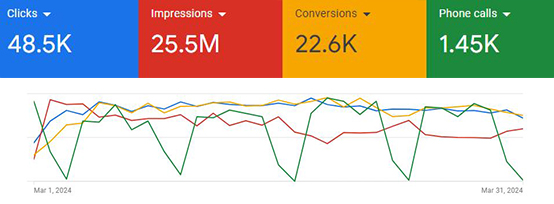
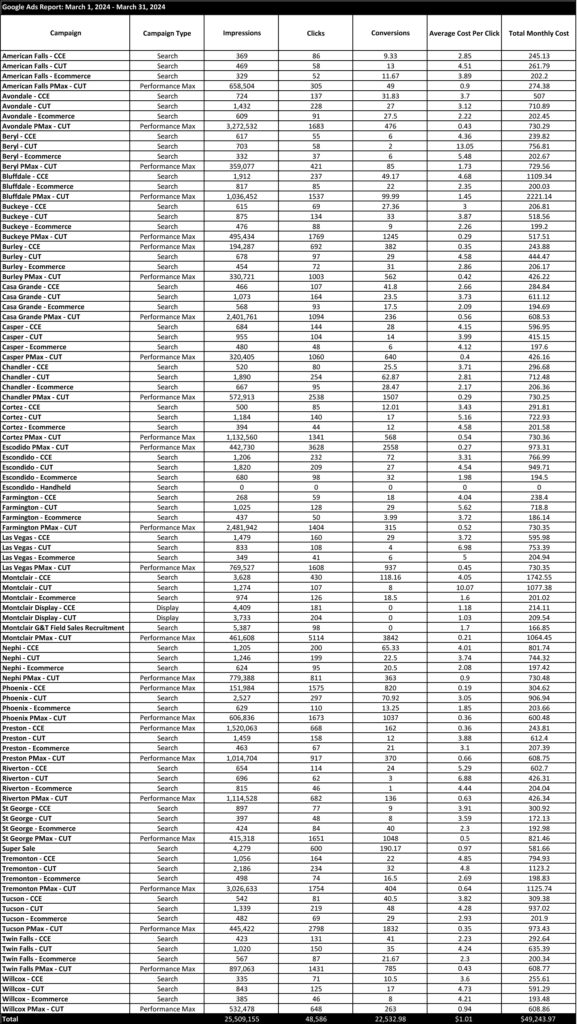
Google Ads

Here is a breakdown of the Google Ad campaign results by store:

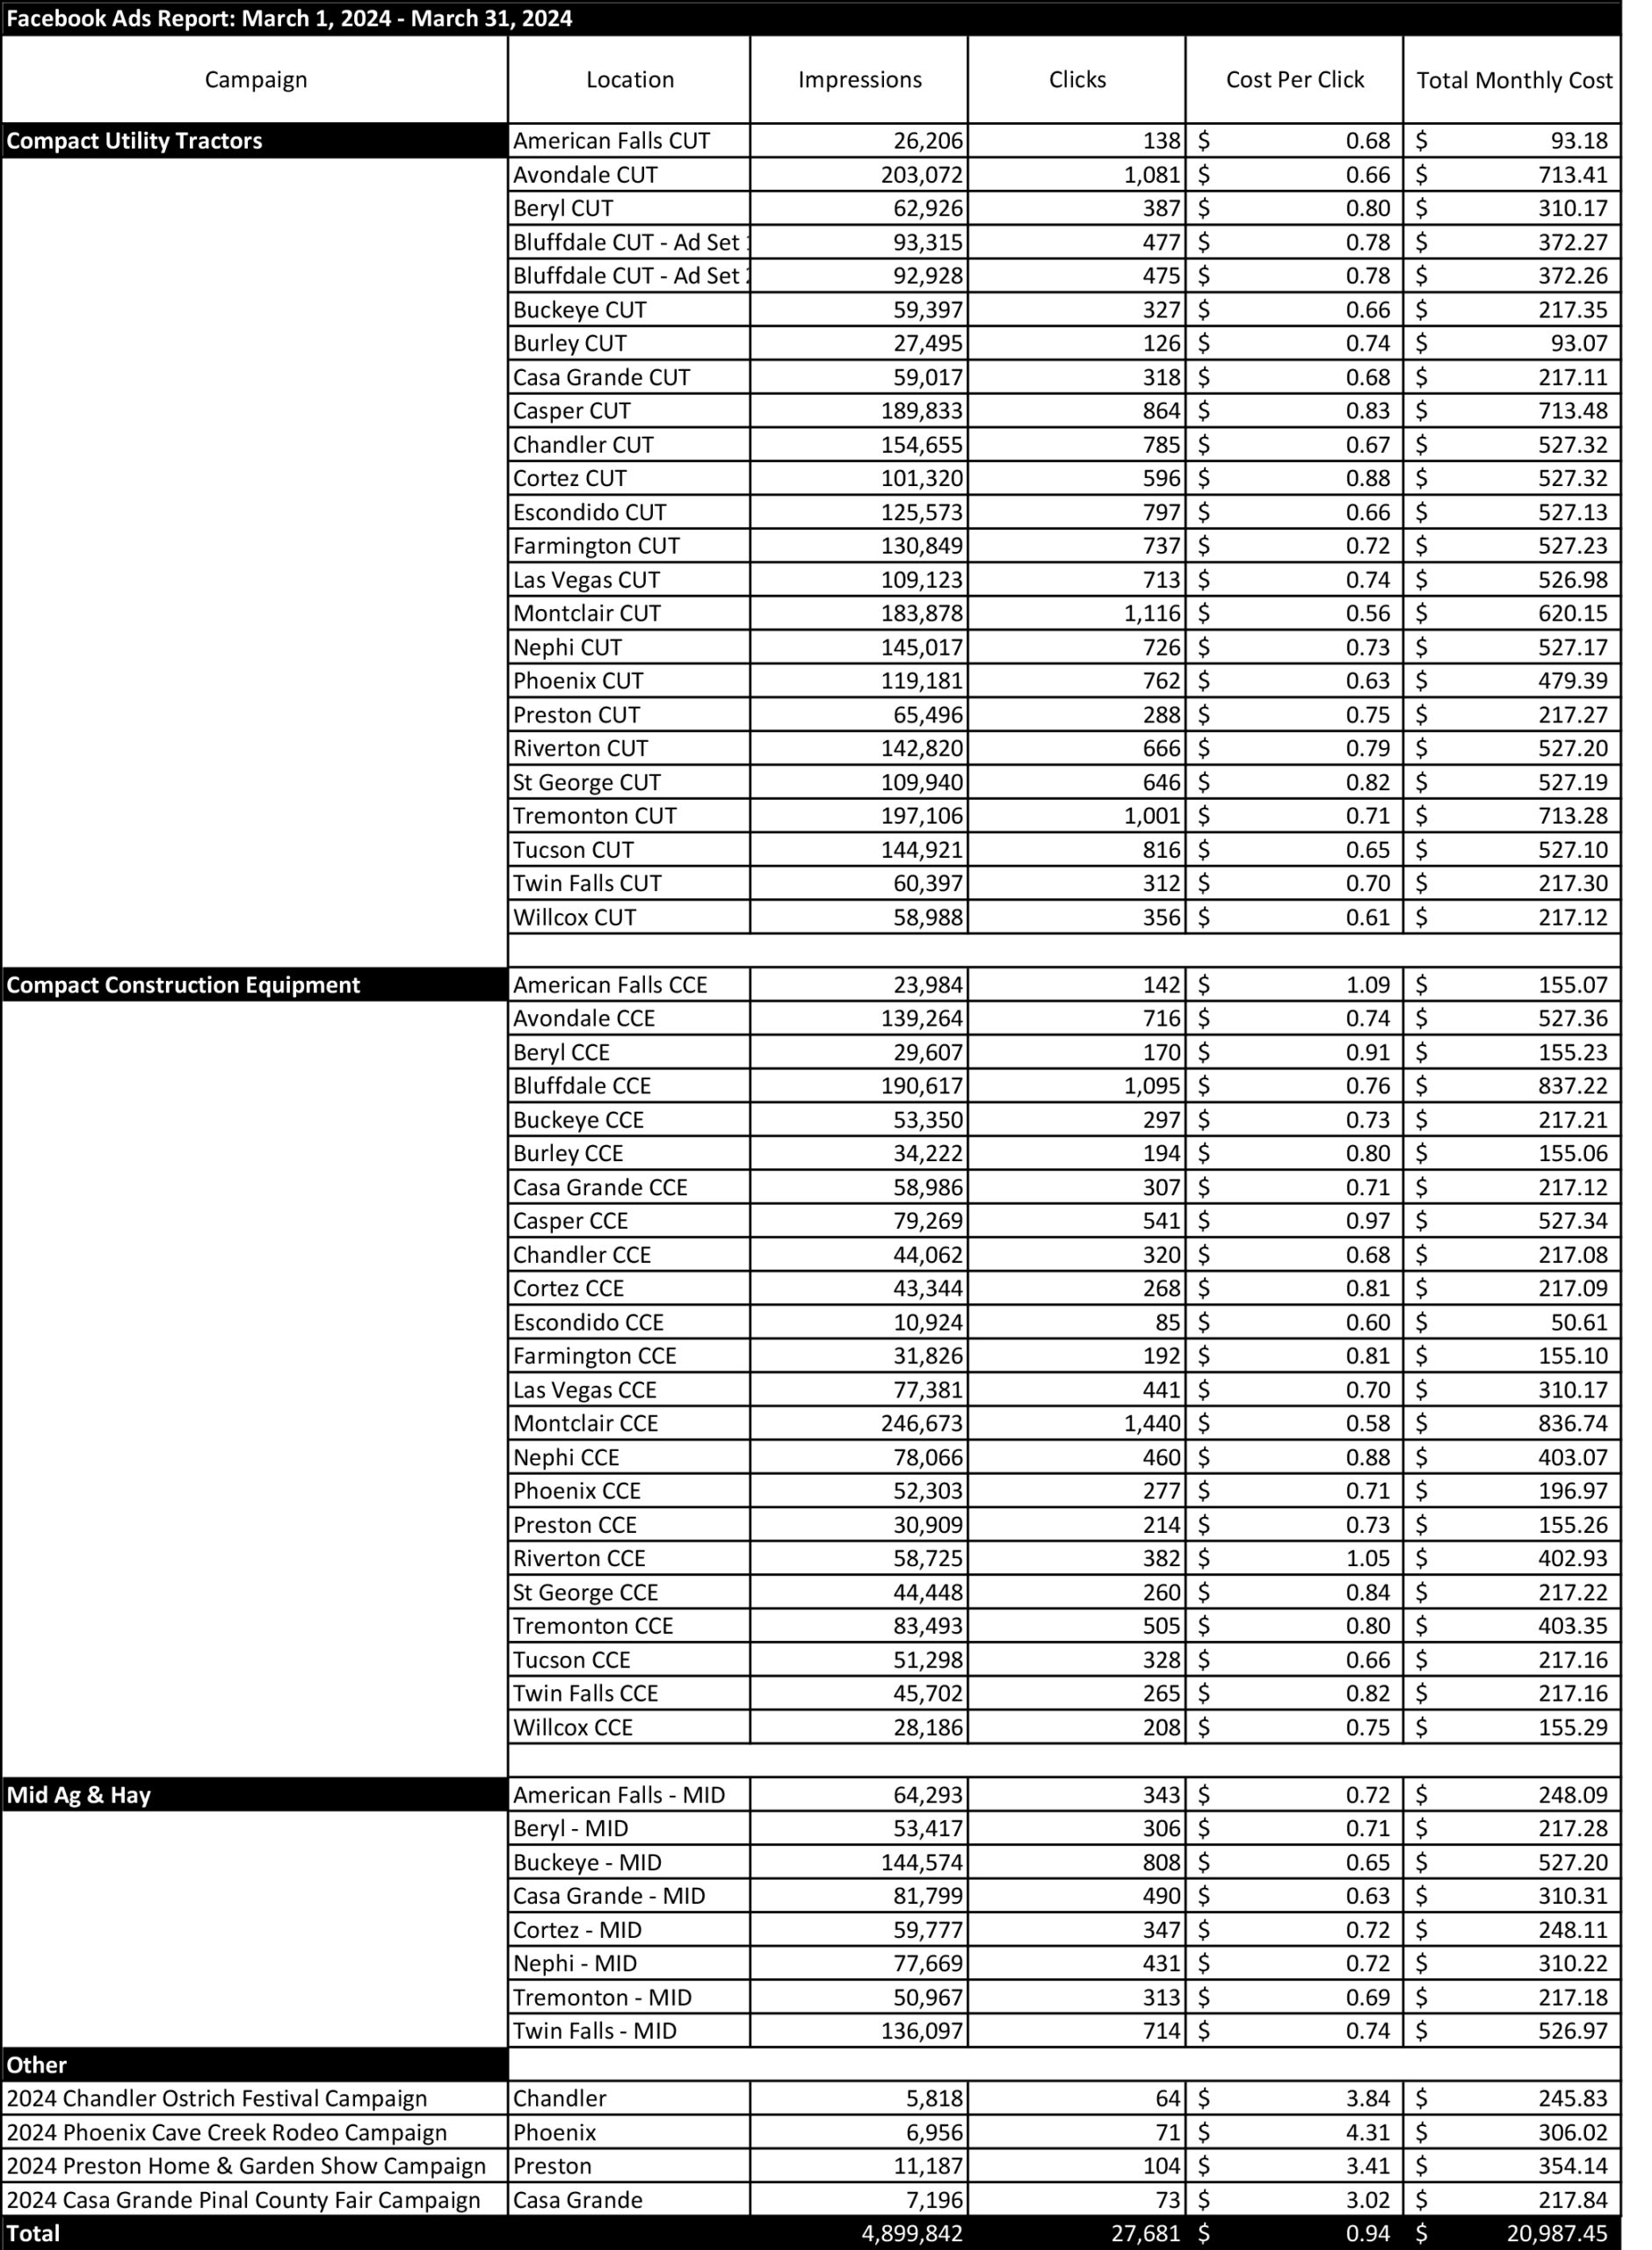
Social Media

Here is an overview of our company-wide Facebook Ads:

Website Analytics

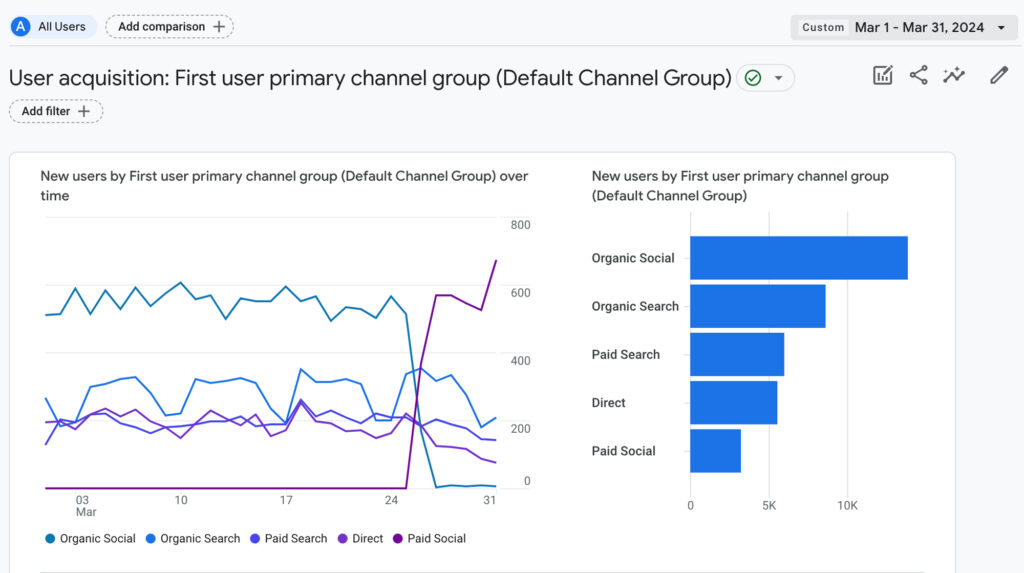
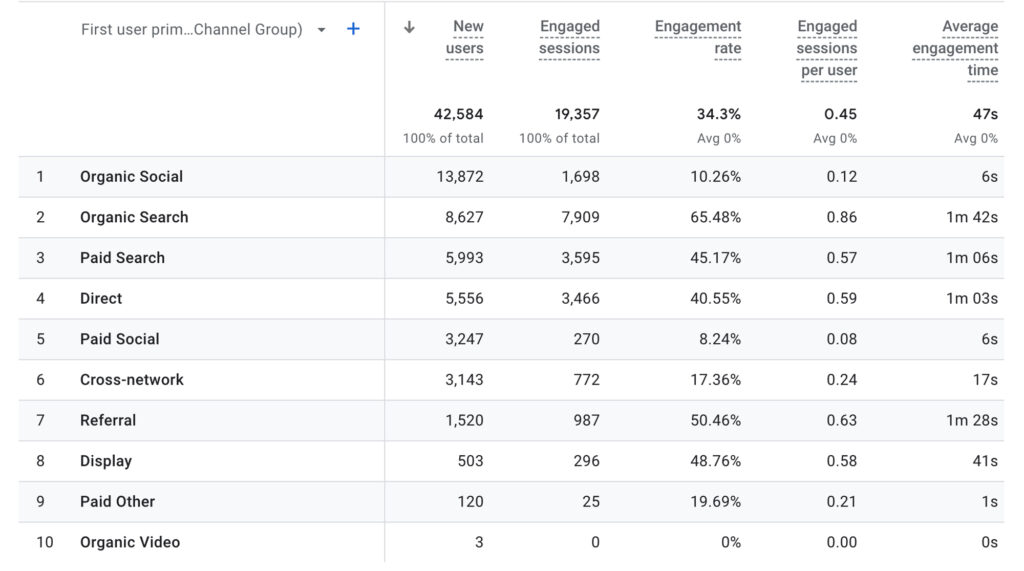
Here is an overview of the acquisition channels for web traffic:

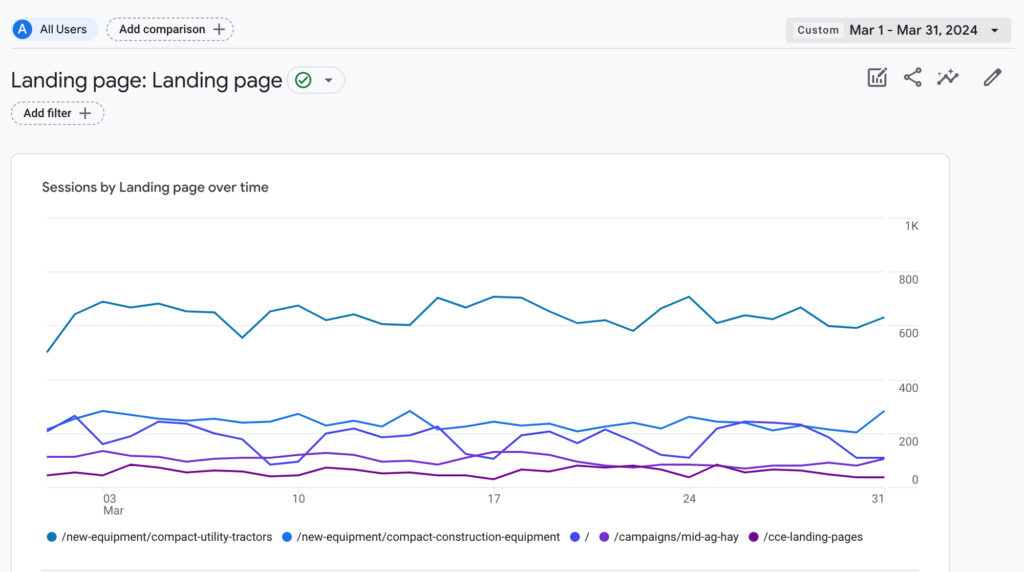
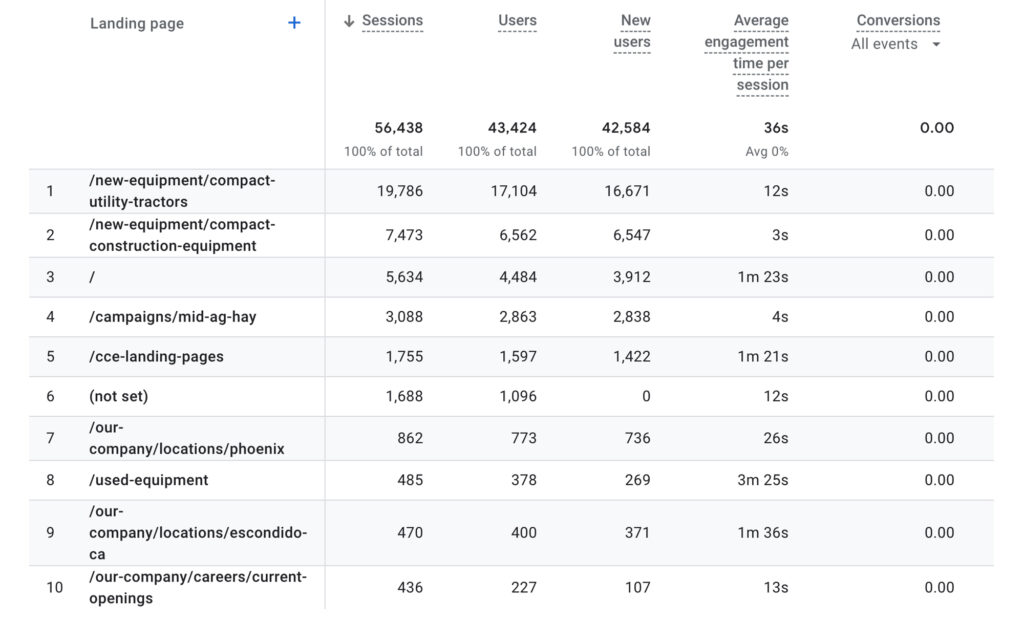
Here is an overview of the most active pages on the website:

Posted on

Tucson Community | Sister Jose Women’s Center

Tucson Community | Sister Jose Women's Center

As a part of their community bonus pool contribution for 2024, the Tuscon store donated $20,000 to the Sister Jose Women's Center.

Sister Jose Women’s Center provides shelter, food, clothing, and other necessities for women who are unhoused. Their goal is to provide life changing support and resources to help women transition out of housing insecurity. The funds donated will be used to help with the expansion of Sister Jose’s operations, including the purchase of beds, lockers, and toiletry items.

Emily Bridson, Director of Philanthropy at the Sister Jose’s, commented, “This work is challenging, and your visit was a bright spot for us. To know our community cares about our guests and supports the work is heartwarming and makes a big difference. It allows us to do what we do every day; to serve women who are unhoused with love, compassion, and dignity. We so appreciate your kindness.” 

Special thanks to the Tucson Team for sending over this wonderful story and pictures to share with the Stotz Community!