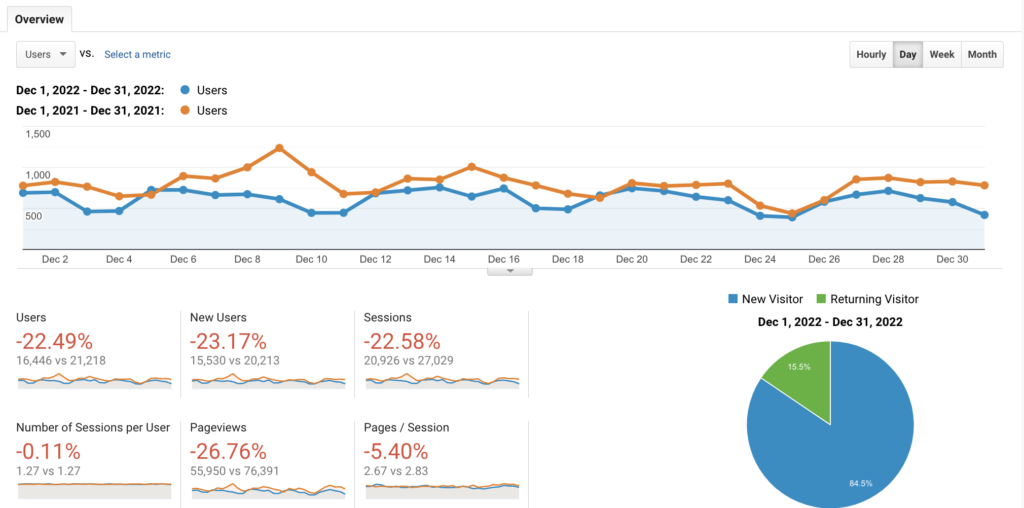
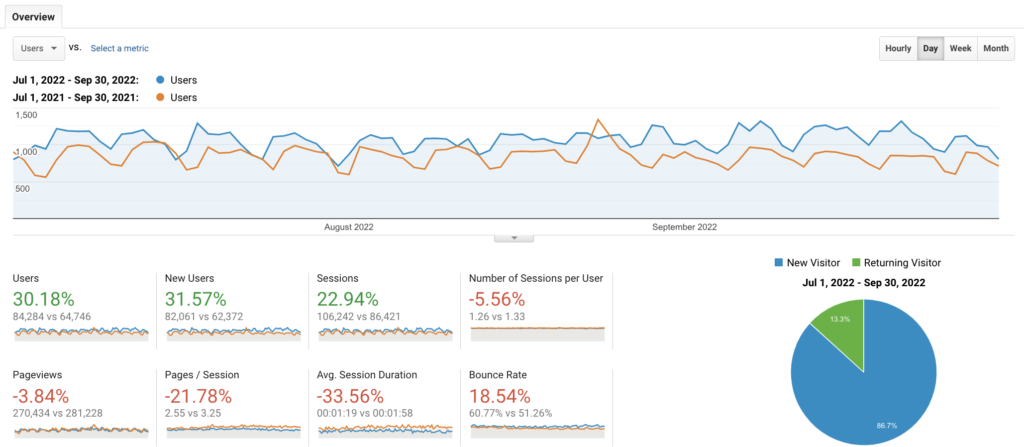
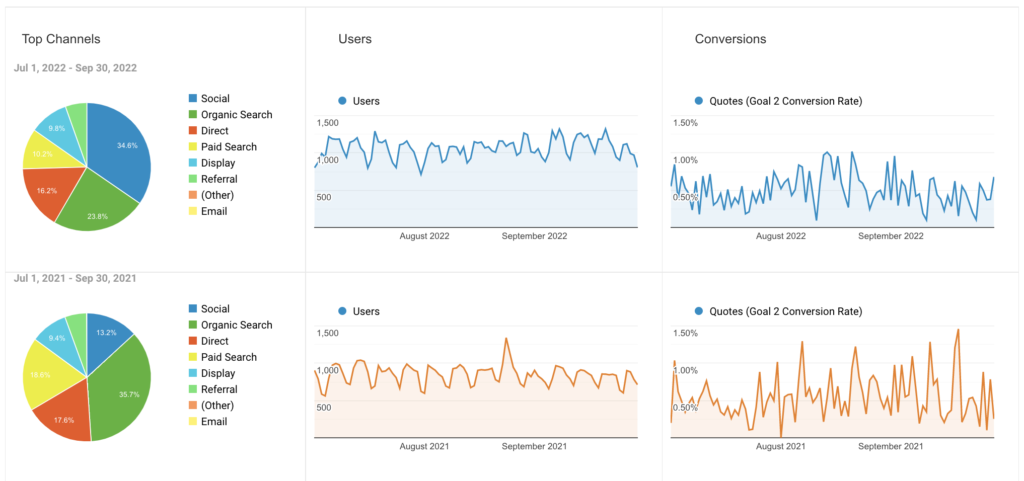
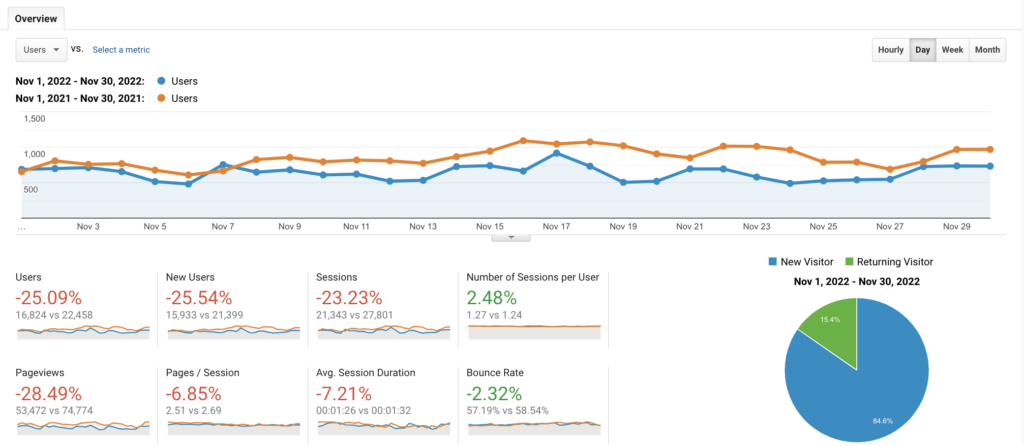
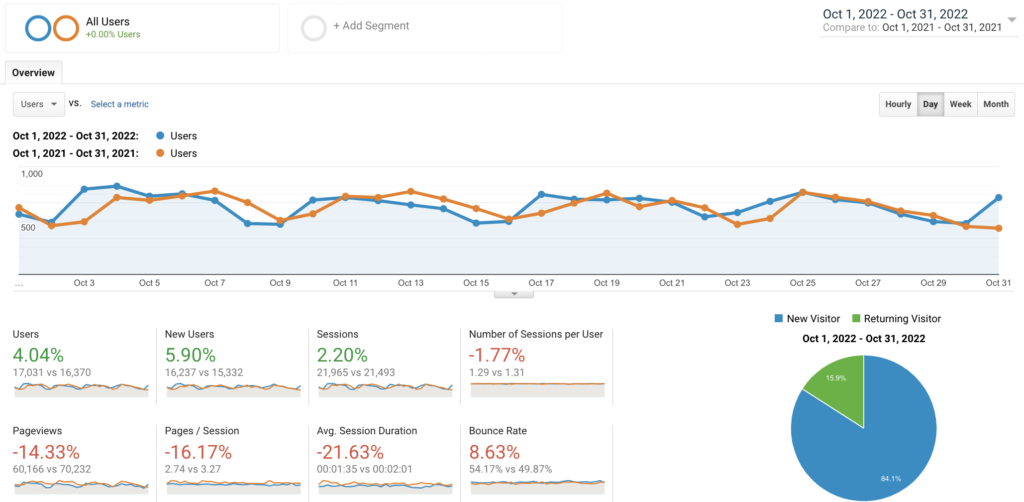
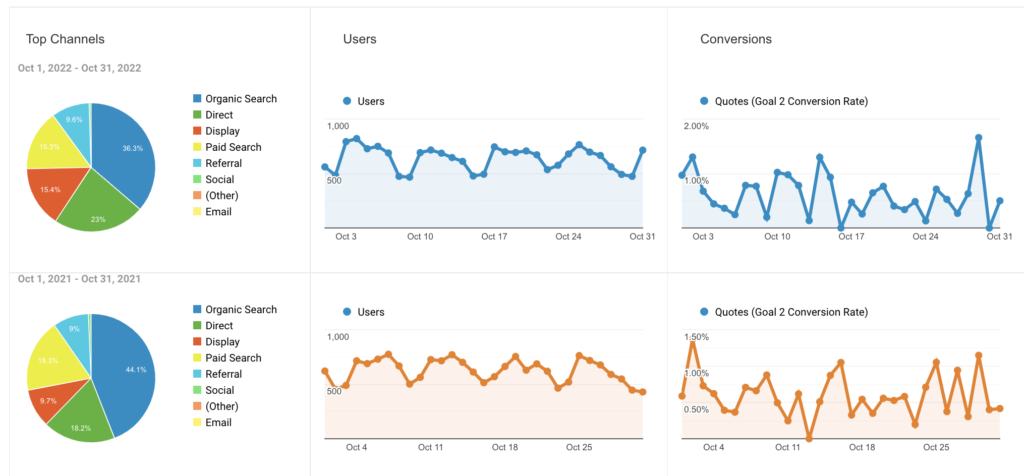
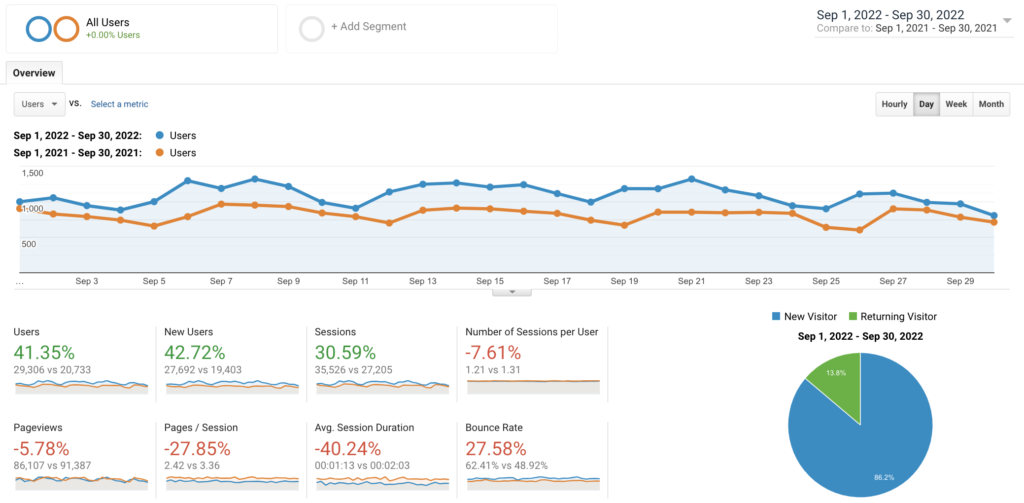
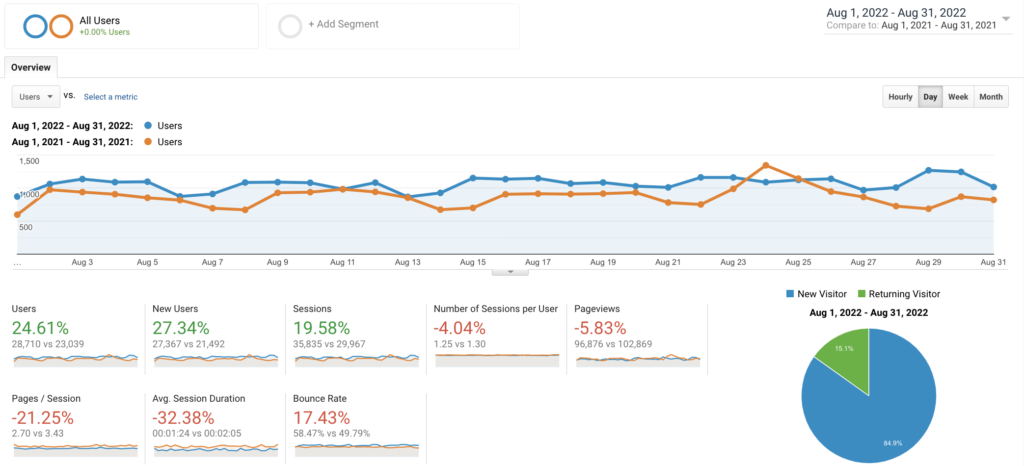
2022’s Q3 overall web traffic shows a good improvement over that of 2021 Q3. As the graph shows, there was an overall increase of 30.18% users and 31.57% new users. The number of overall sessions, that is the number of instances that a user visited the site, increased by 22.94%.
The decreases in the sub-categories of sessions per user, and page views, are all consistent with an overall increase in number of people using the website. They show opportunities for optimization but are not unexpected.
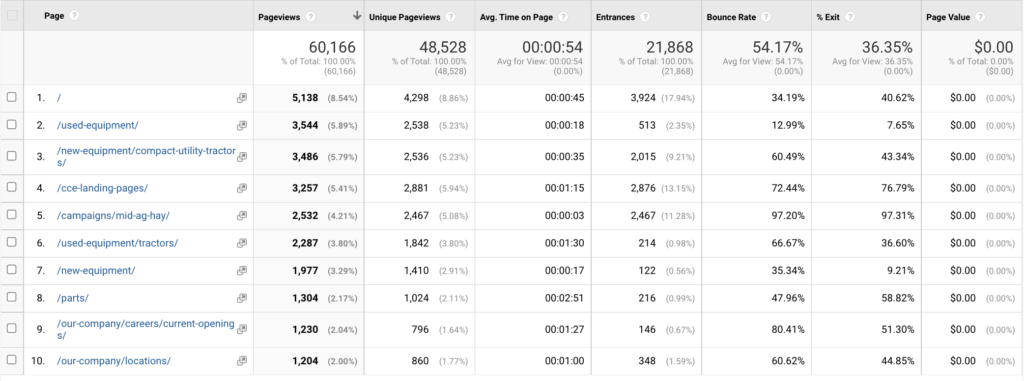
There are opportunities for improvement with respect to the pages/session, avg. session duration, and bounce rate metrics. The challenge presented by this data is to increase the readily available functions and actions for users on a given webpage. The goal is that users travel from where the entered the site, to follow-up tasks and information. For example, a user who arrives onto the store information page for their local Stotz Equipment will then follow the pathway of information to filling out a contact form, parts ordering form, or service scheduling form. Another example would be for a user who enters the site on a small tractor landing page but then continues on to requesting a quote or visiting the store information page for their local Stotz Equipment.
2. User Demographics
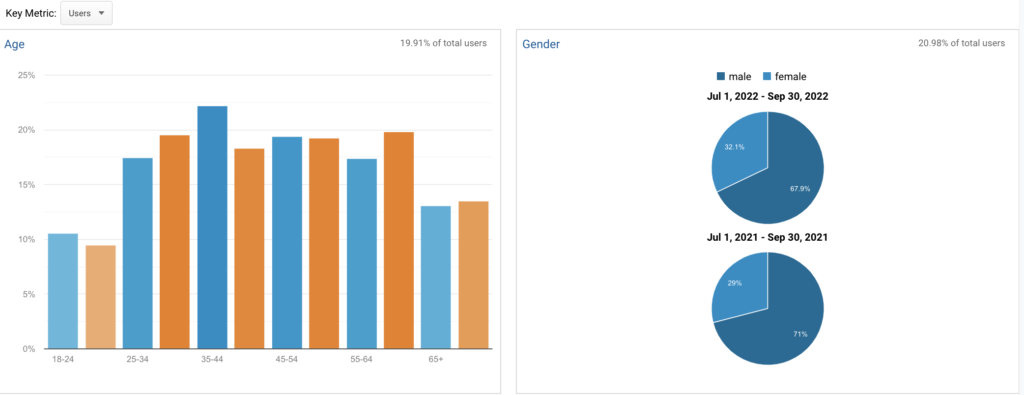
User demographics for 2022 Q3 showed some changes to that of 2021 Q3. There were small decreases in the number of site users aged 55-65, 25-34, and very small decrease in the 65+ age group. These decreases translated to small increases in the number of users aged 18-24, 45-54, and a large increase in users aged 35-44. There were also minor changes in gender demographics for a 3.1% increase in female users.
3. User location
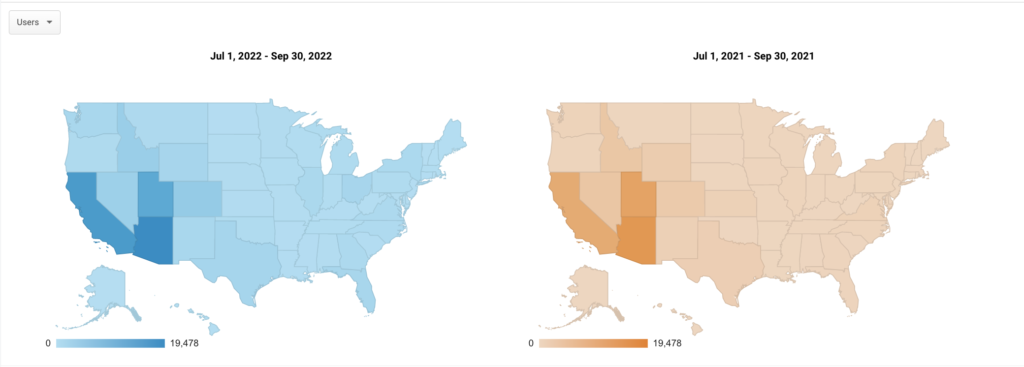
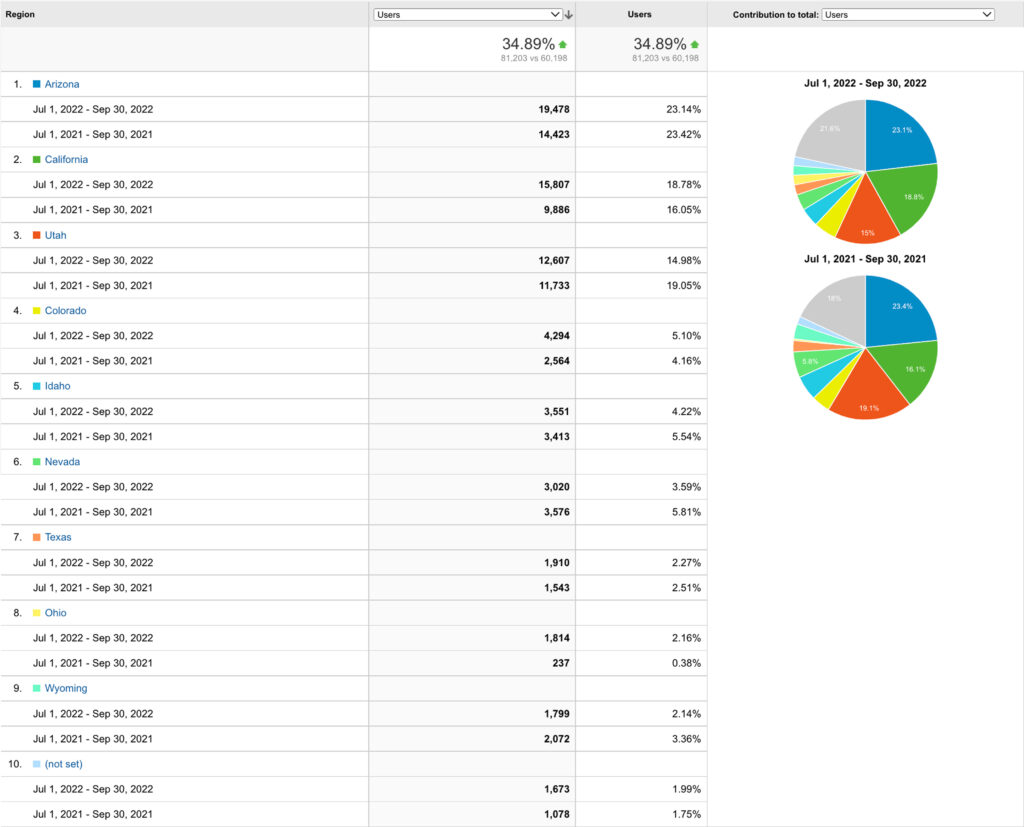
The location of website users in 2022 Q3 was consistent with that of 2021 Q3. This is a good thing as it shows that the vast majority of the site content is reaching customers and potential customers.
In 2022 Q3, however, there were large increases in the total number of users in AZ and CA: 14,423 to 19,478 and 9,866 to 15,807 respectively. This is great news as it shows the growth experienced in the total number of users on the site, were users located in Stotz Equipment AOR.
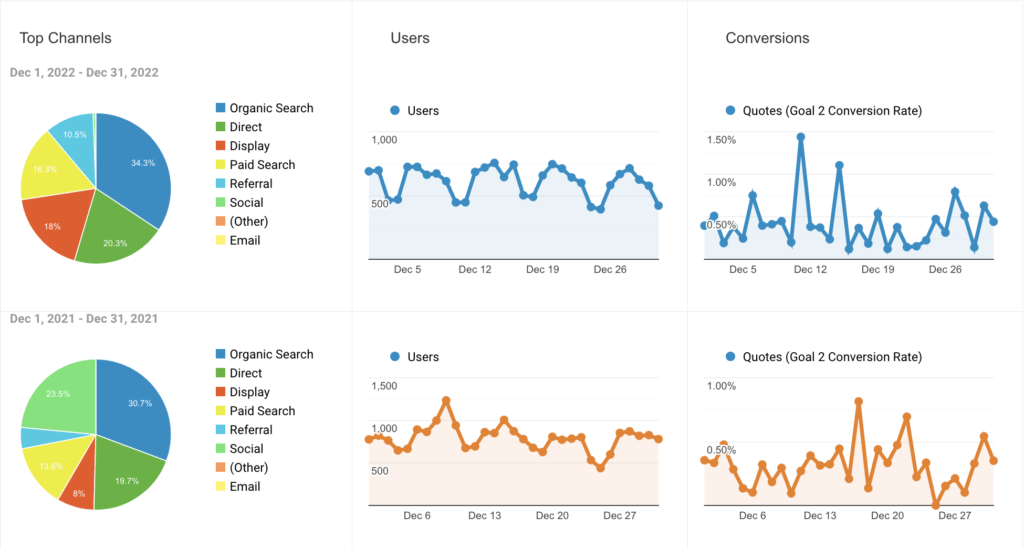
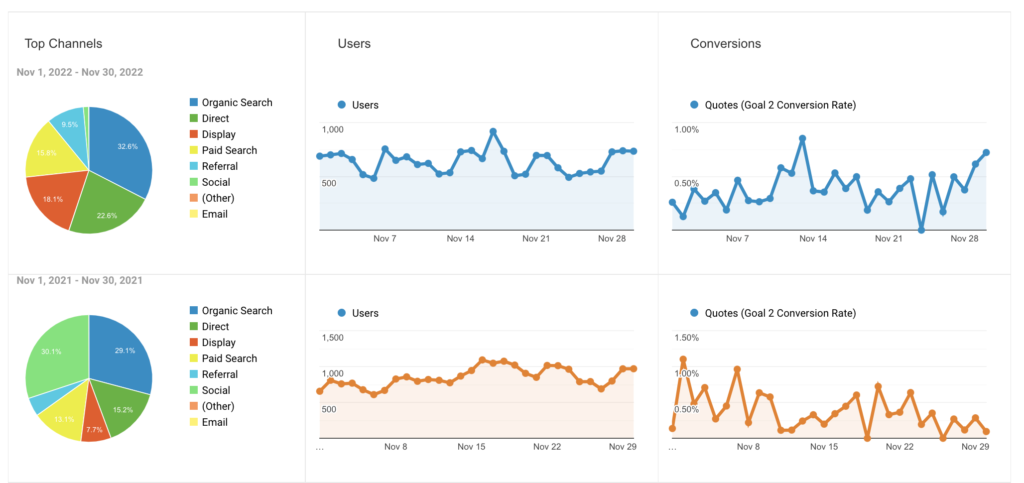
4. User Acquisition
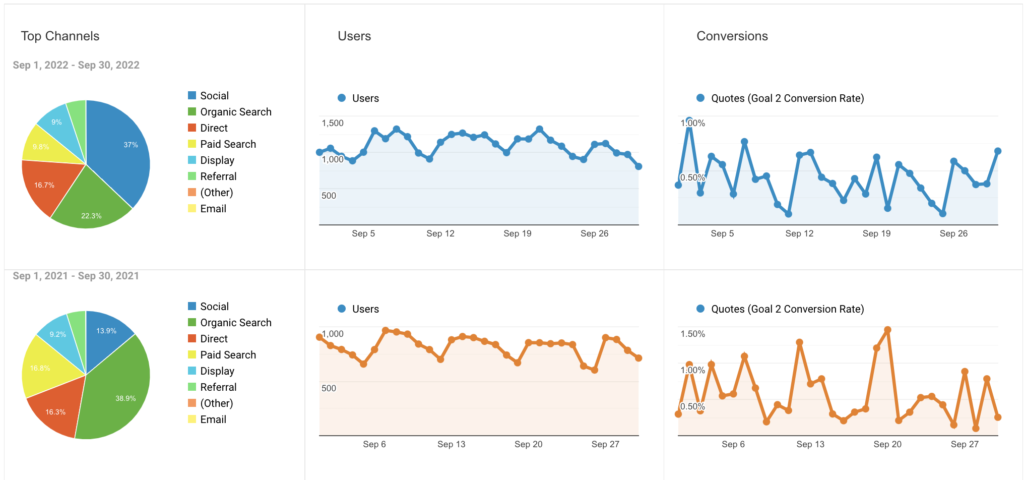
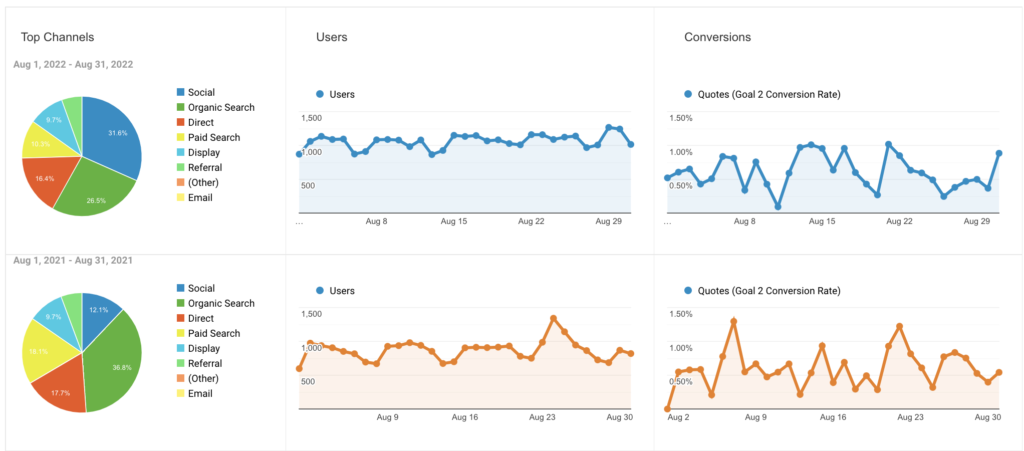
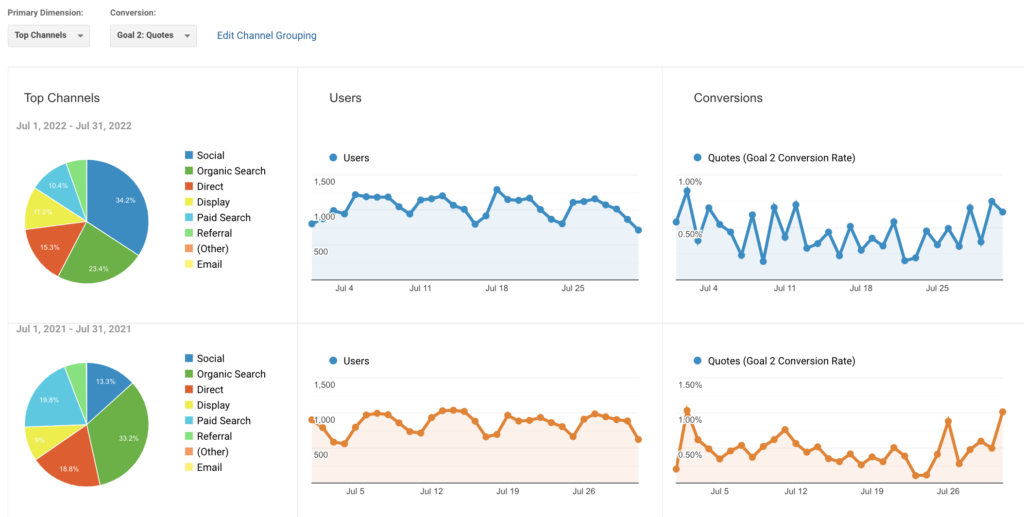
The user acquisition in 2022 Q3 show one significant change to that of 2021 Q3: An increase in Social Media-acquired traffic from 13.2% to 34.6%. This large jump account for the overall increase in the number of web users by ~30%.
Website Updates & Improvements
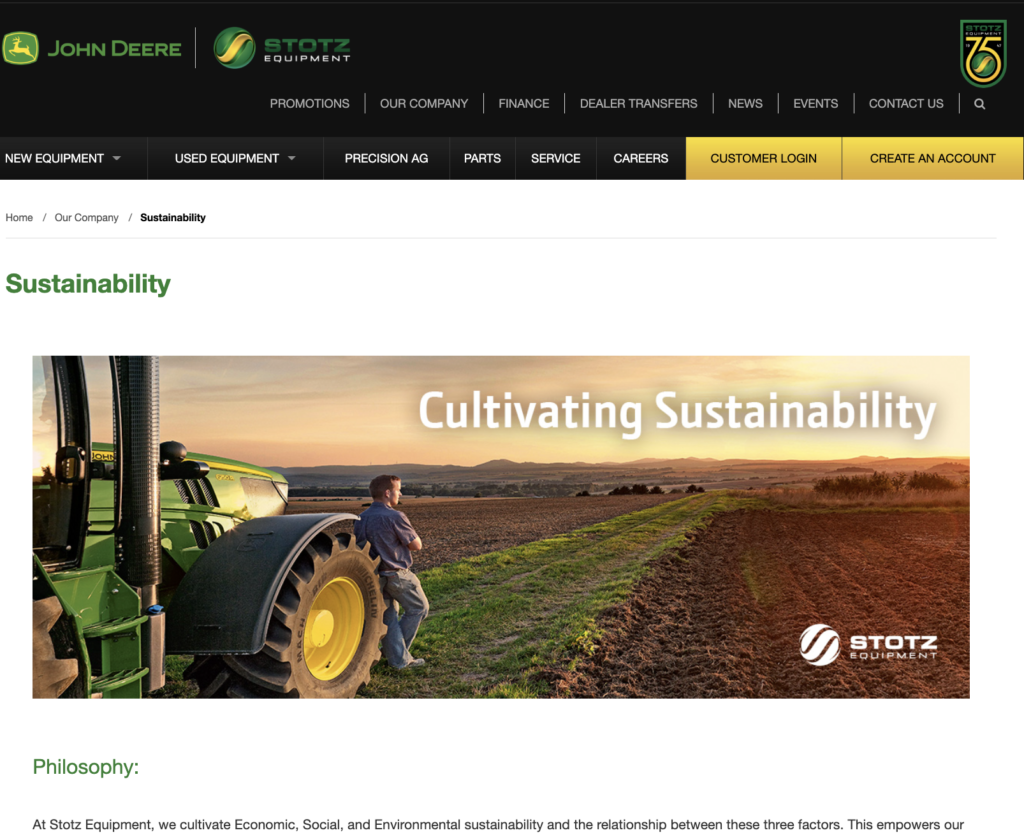
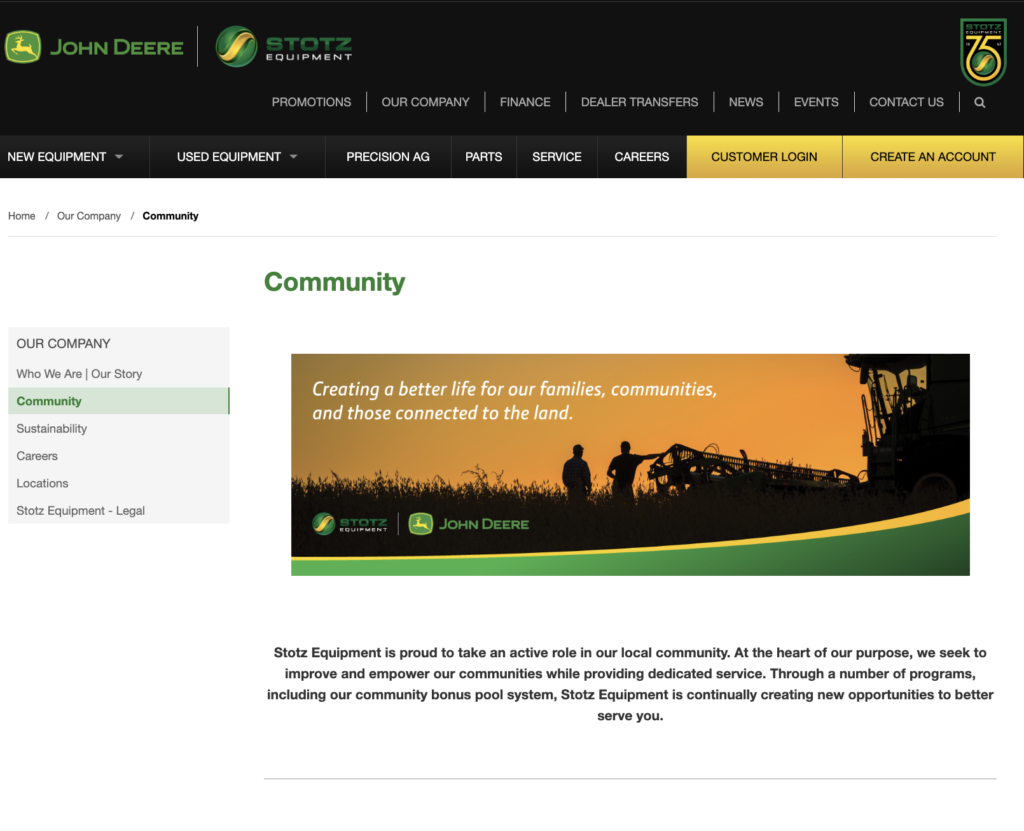
Over the last few months the Marketing Team has developed and launched new web content and pages. Two major highlights are the sustainability and community pages.
Additional web content projects currently in production:
Updated and expanded careers page
Additional new content and subpages for Stotz Precision
Updated location information page template
Marketing Center Updates & Improvements
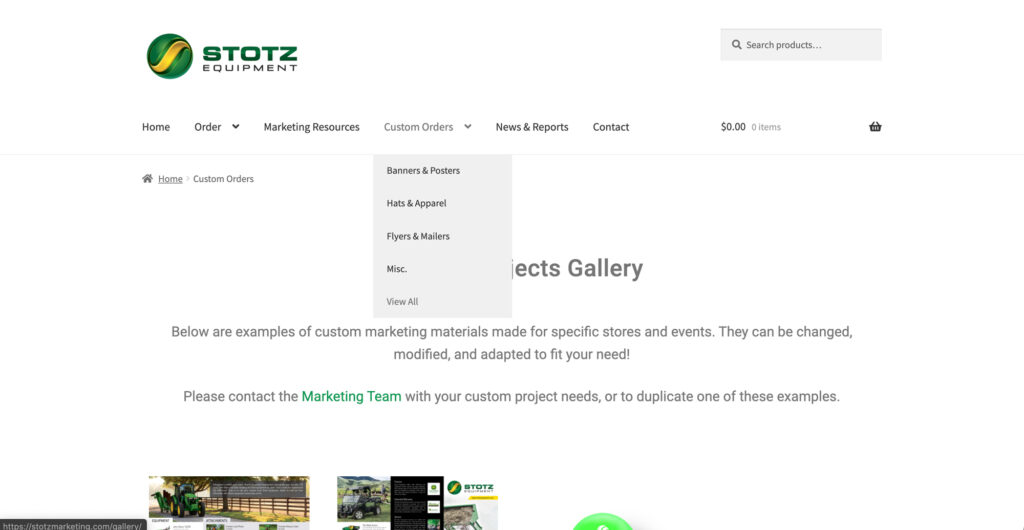
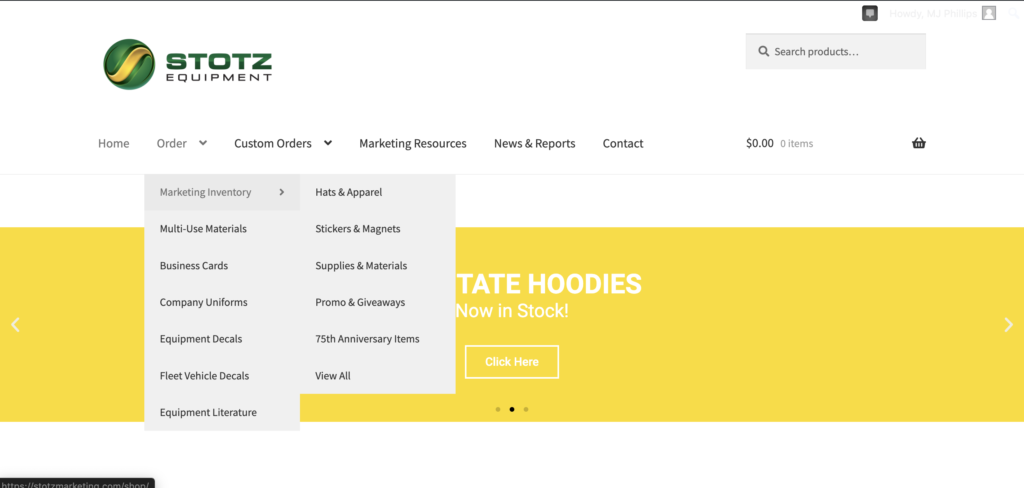
As a reminder, the Custom Orders section of the marketing center highlights individual projects the marketing team has recently completed. If you are ever wondering, “Can the marketing team help make this?” Check the Custom Orders section for a similar project, or for marketing inspiration.
As the number of items and offerings increased in the marketing center, the order navigation has expanded as well. There are more products and resources available now for order than ever before through the marketing center.
For suggested items, resources, processes, etc. please don’t hesitate to contact the Marketing team. The marketing center continues to be a diverse online tool for the growing company. The goal is to constantly improve upon it to make your life easier.
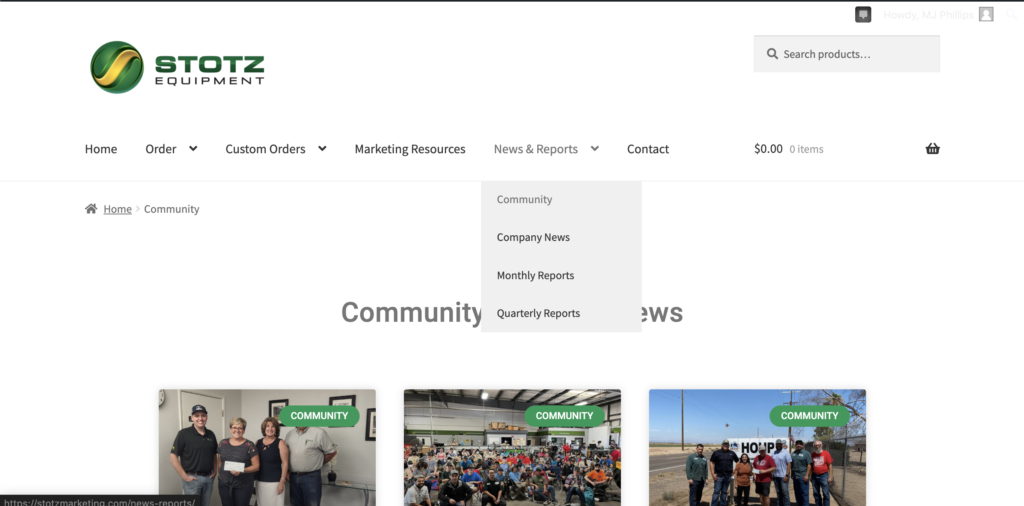
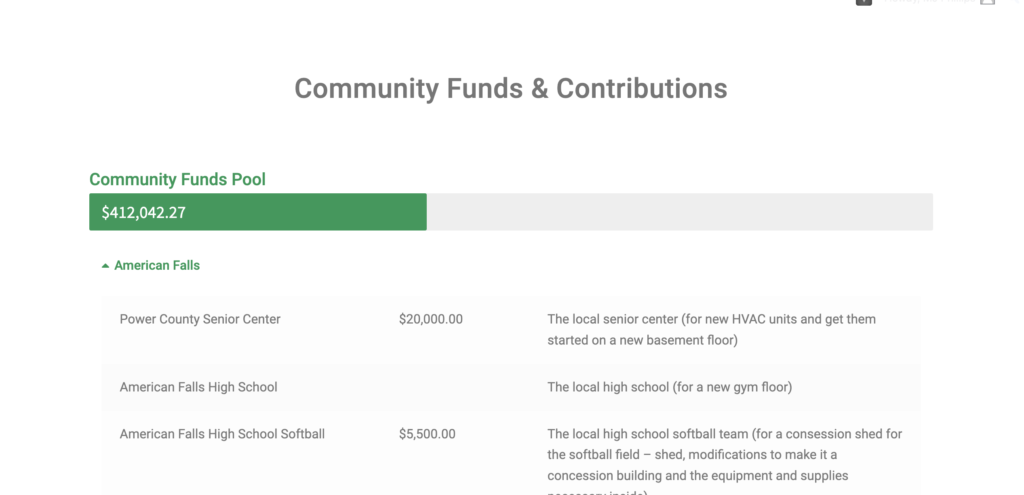
Finally, the Marketing Team is excited to share the launch of our Community page on the Marketing Center. The Community page serves as an aggregate for community involvement and donation stories from within the Stotz Community. It is also a place to record and report community funds and giving.
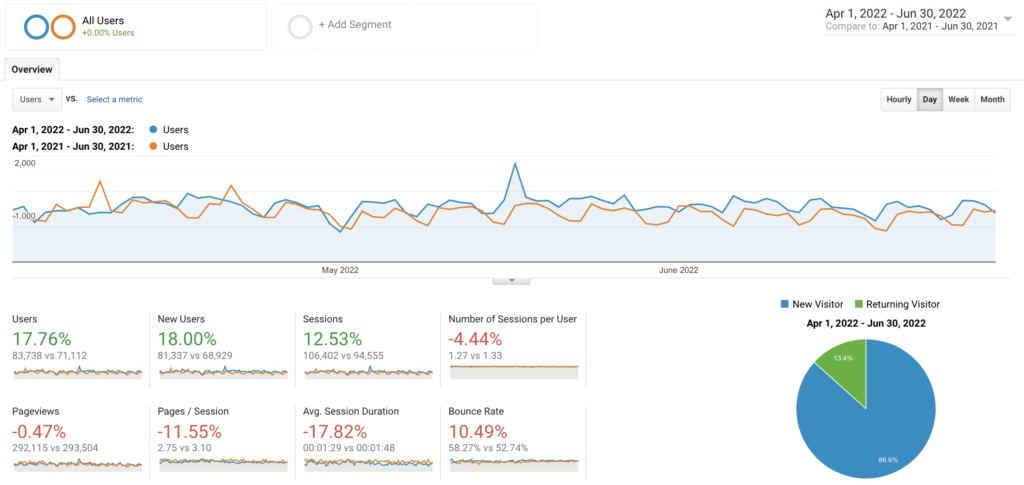
2022’s Q2 overall web traffic shows an improvement over that of 2021 Q2. As the graph shows, there was an overall increase of 17.76% users and 18% new users. The number of overall sessions, that is the number of instances that a user visited the site, increased by 12.53%.
The decreases in the sub-categories of sessions per user, and page views, are all consistent with an overall increase in number of people using the website. They show opportunities for optimization but are not unexpected.
There are opportunities for improvement with respect to the pages/session, avg. session duration, and bounce rate metrics. The pages/session decrease shows both a positive and negative user experience. On the one hand, it seems like users are finding the exact information they are looking for faster, not needing to navigate through multiple pages. On the other, it would be ideal that users would organically travel from one topic of information to the next, navigating to additional pages. Improving this behavior would also dramatically increase the the metrics of avg. session duration and bounce rate. The solution and plan of action is to continue optimizing the pathways of information and action. This would aid users in having an increased sense of accomplishment and clear pathway to success when using the site.
Other than a spike of use in the second week of May, 2022, the user behavior patterns were consistent with that of the Q2, 2021.
2. User Demographics
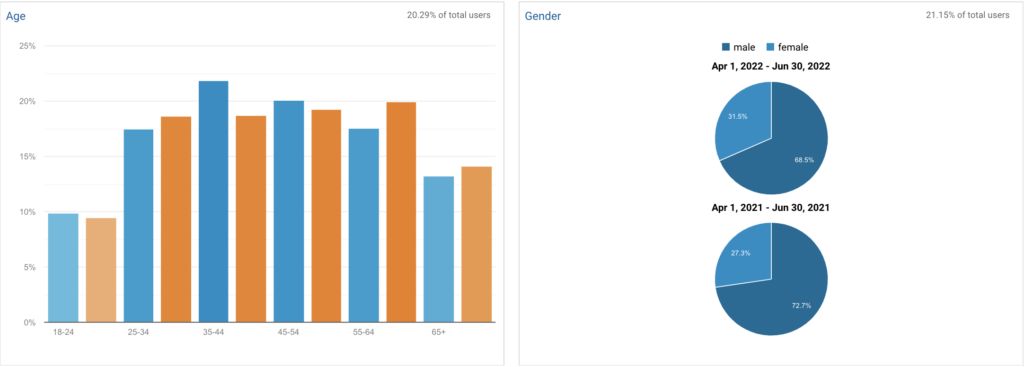
User demographics for 2022 Q2 showed minor changes to that of 2021 Q2. There was a small increase in the total number of female users to the site of about ~4%, demonstrating that the site is reaching a wider audience. The breakdown of female and male users in 2022 Q2 was 31.5% and 68.5% respectively.
There were minor changes in age demographic, with the most notable being a slight increase in users aged 35-44 years old. And a slight decrease in ages 55-64. Overall the age demographic is evening across the board, again demonstrating that the site is reaching a wider audience.
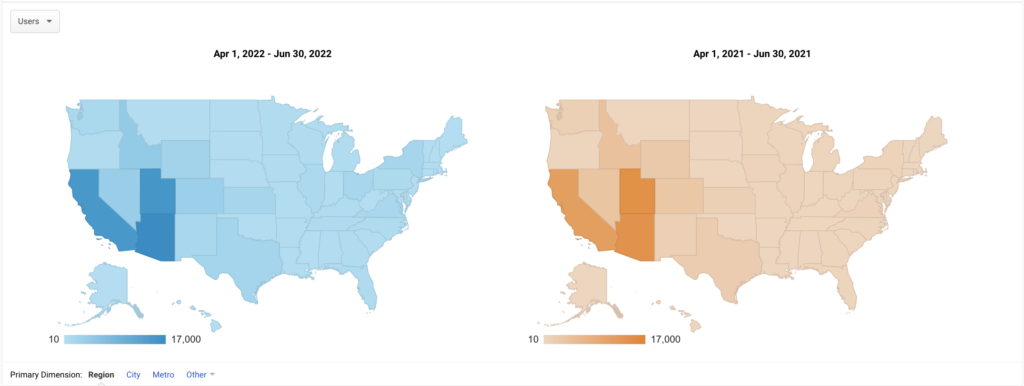
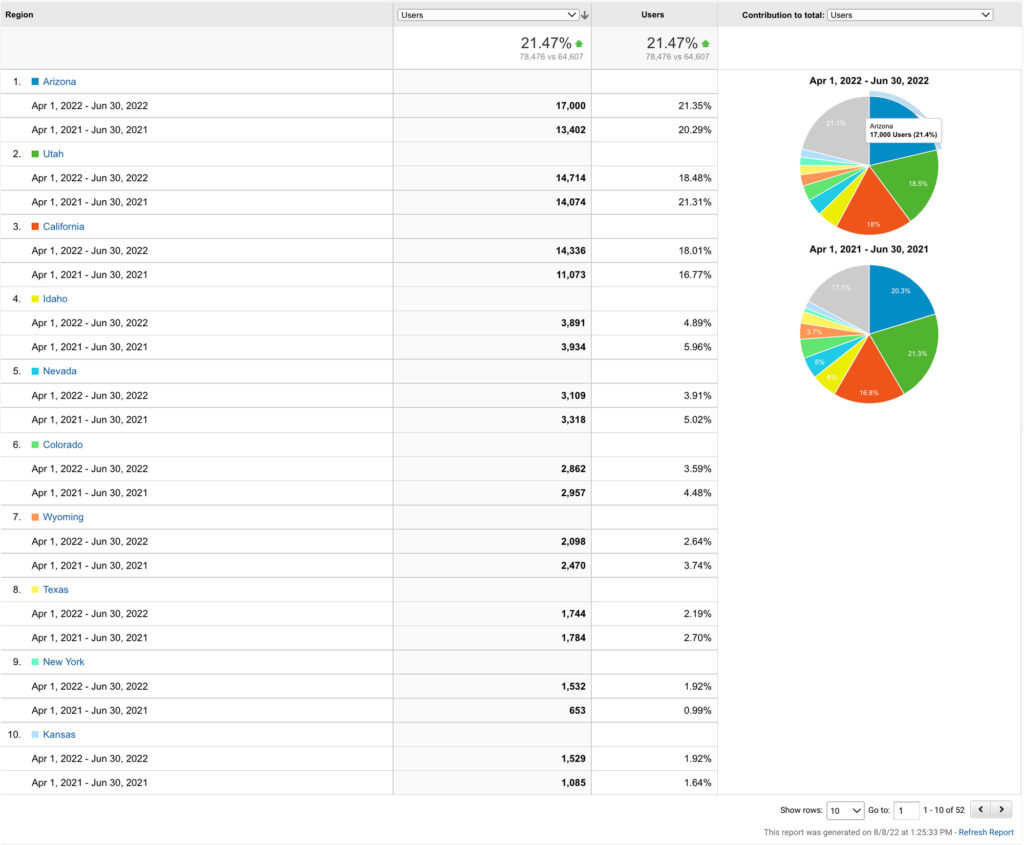
3. User location
The location of website users in 2022 Q2 was consistent with that of 2021 Q1. This is a good thing as it shows that the vast majority of the site content is reaching customers and potential customers.
In 2022 Q2, however, there were massive increases in the total number of users in AZ and CA: 13,402 to 17,000 and 11,073 to 14,336 respectively. This is great news as it shows the growth experienced in the total number of users on the site, were users located in Stotz Equipment AOR.
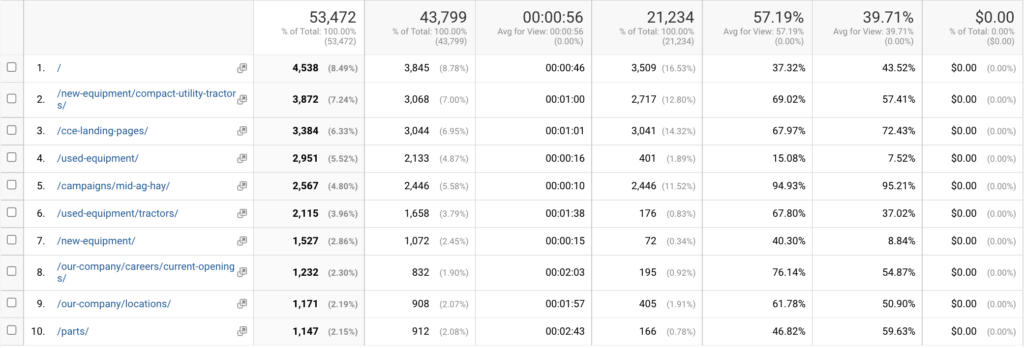
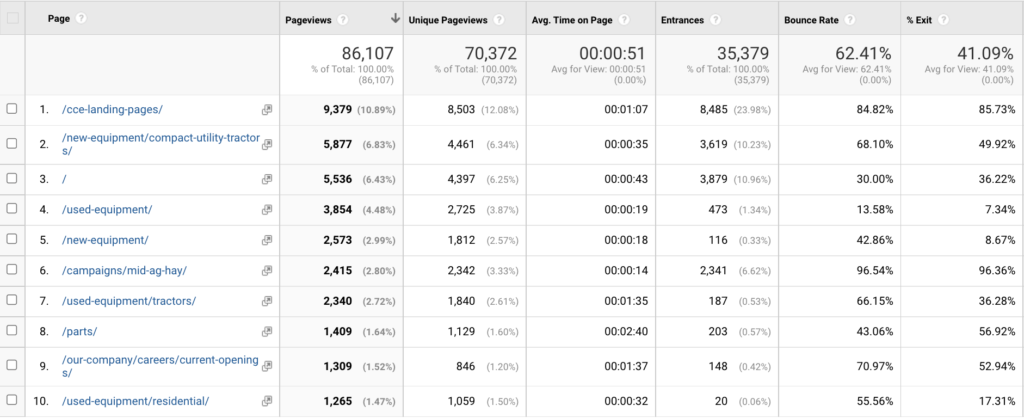
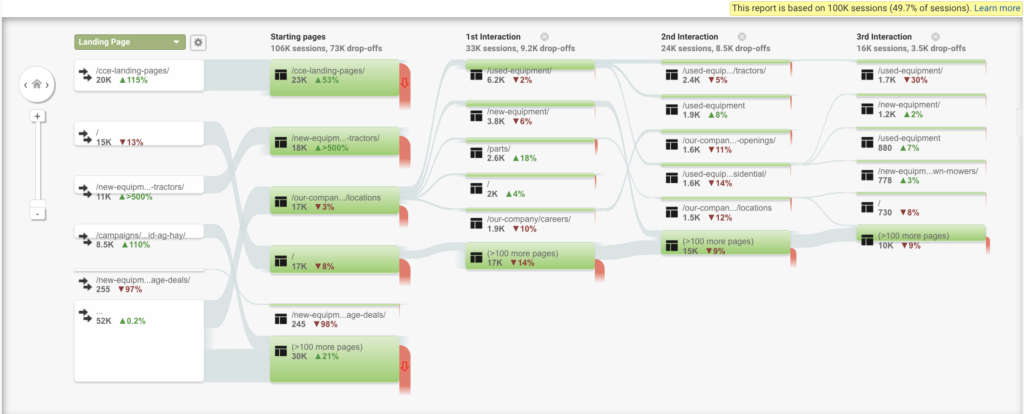
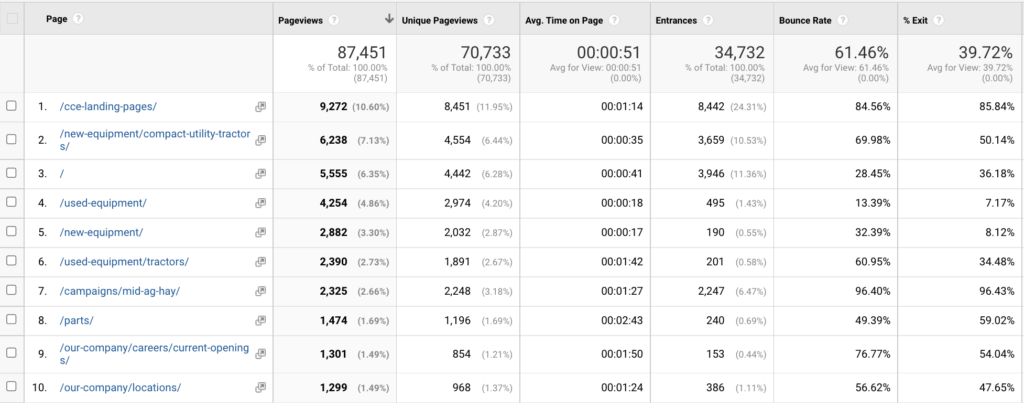
4. User Behavior/Content Flow
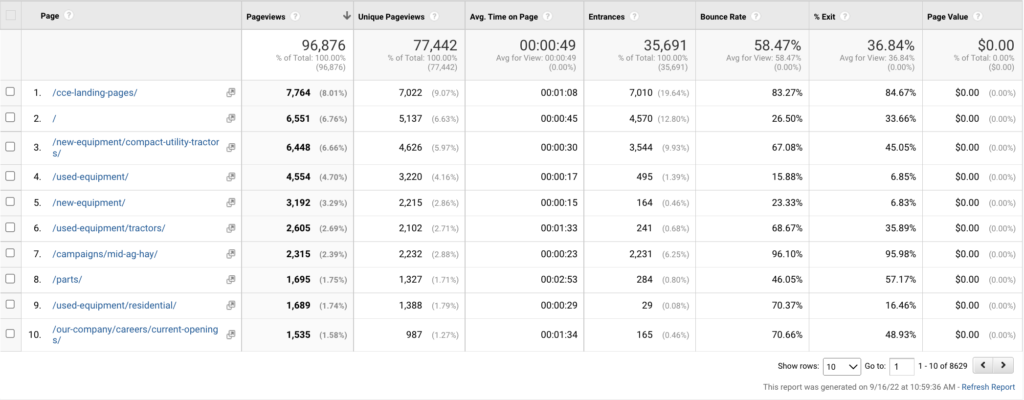
The website user behavior of 2022 Q2 continues to demonstrate the success of the CCE department efforts in sales and marketing. There are also huge gains of website entry on the mid-ag and hay landing page, and CUTs landing pages. All three success pose opportunity for improvements. The behavior flow demonstrates that users who enter the site from the home page tend to navigate to sub-pages more frequently and for a longer amount of time.
By building new calls of action and objectives into the CCE, CUT, and Mid-ag/hay landing pages, the number of drop-off and bounces, will decrease.
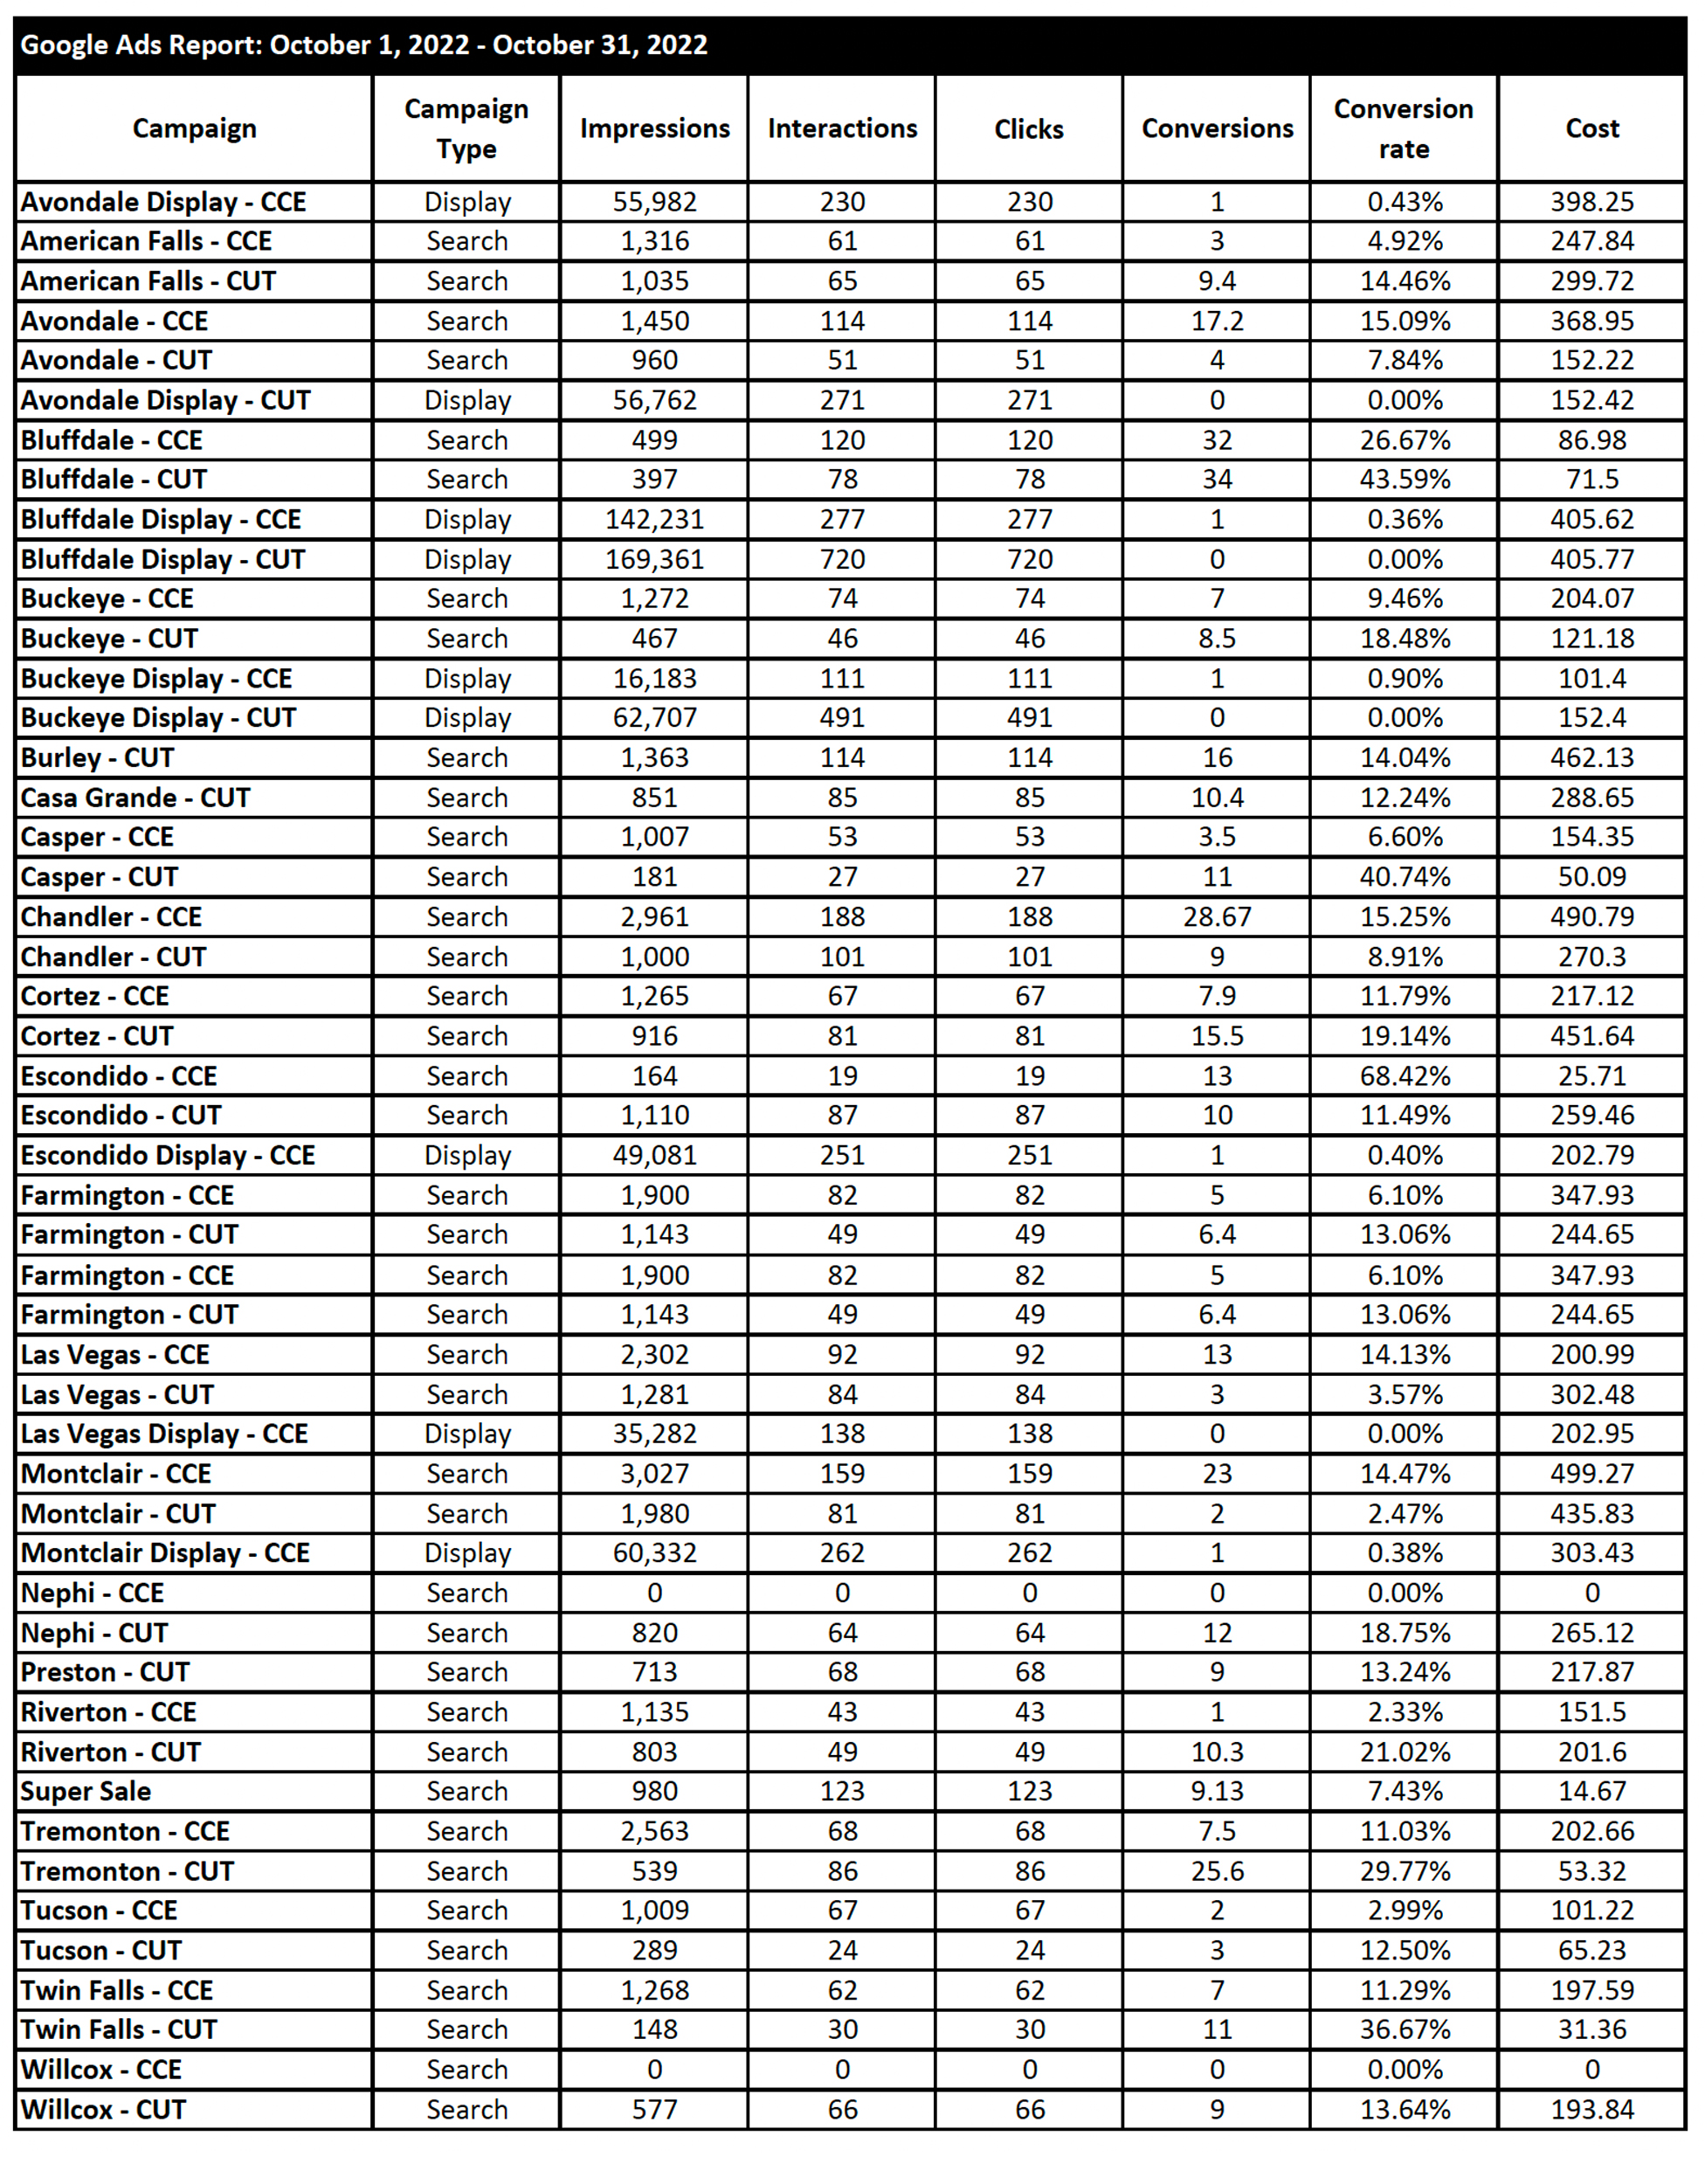
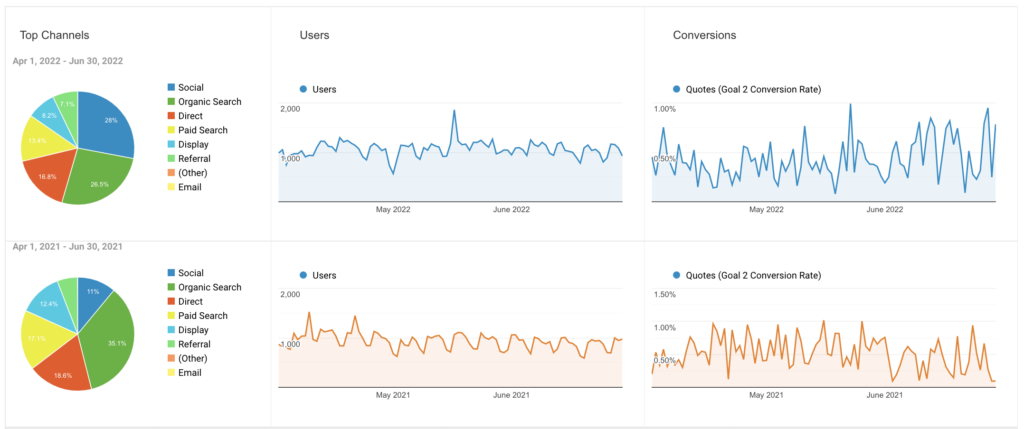
5. User Acquisition
The user acquisition in 2022 Q2 shows minor variation to that of 2021 Q2, other than in the cases of social vs organic traffic. Because of the increased number of social ads and campaigns, the percentage of acquisition changed from 11% to 28%. The remaining acquisition channels remained similar (minor decreases in paid and display ads), resulting in an overall decrease in the amount of organic traffic.
This however does not cause concern because the overall number of users saw such a large increase, meaning that the majority of those users were the target of social ads within our AOR and not because of a sudden decrease in organic ranking.
Website Updates & Improvements
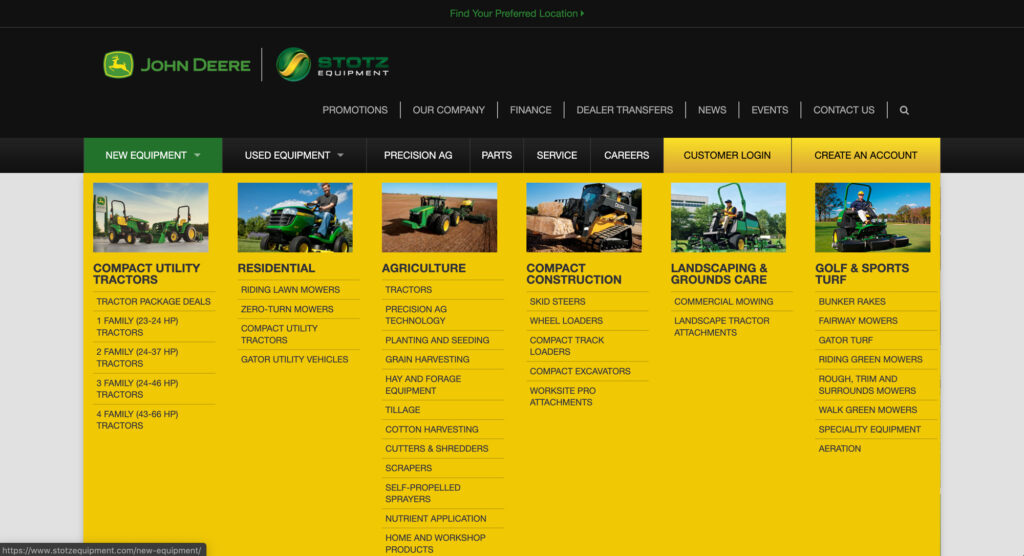
For several months, the Marketing team has been working on significant content organization and display changes in the new equipment sections of the website. Many of the changes have already been put in place: increased product descriptions, multi-media content from John Deere, and more intuitive behavior paths for users. Most notably, in the CUTs category and sub-pages resulting in the behavior increases shown in the previous analytics section.
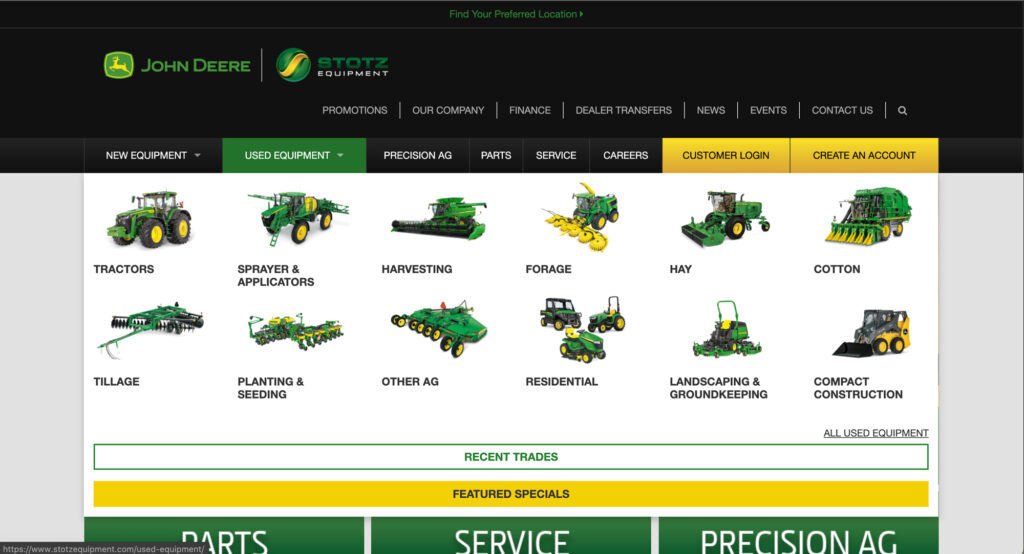
The final changes will be implemented shortly, culminating in a visual interface update to the new equipment navigation, which can be seen in the used equipment navigation. The used equipment category received a similar treatment in 2020-2021:
Marketing Center Updates & Improvements
As a reminder, the Custom Orders section of the marketing center highlights individual projects the marketing team has recently completed. If you are ever wondering, “Can the marketing team help make this?” Check the Custom Orders section for a similar project, or for marketing inspiration.
As the number of items and offerings increased in the marketing center, the order navigation has expanded as well. There are more products and resources available now for order than ever before through the marketing center.
For suggested items, resources, processes, etc. please don’t hesitate to contact the Marketing team. The marketing center continues to be a diverse online tool for the growing company. The goal is to constantly improve upon it to make your life easier.
Finally, the Marketing Team is excited to share the launch of our Community page on the Marketing Center. The Community page serves as an aggregate for community involvement and donation stories from within the Stotz Community. It is also a place to record and report community funds and giving.
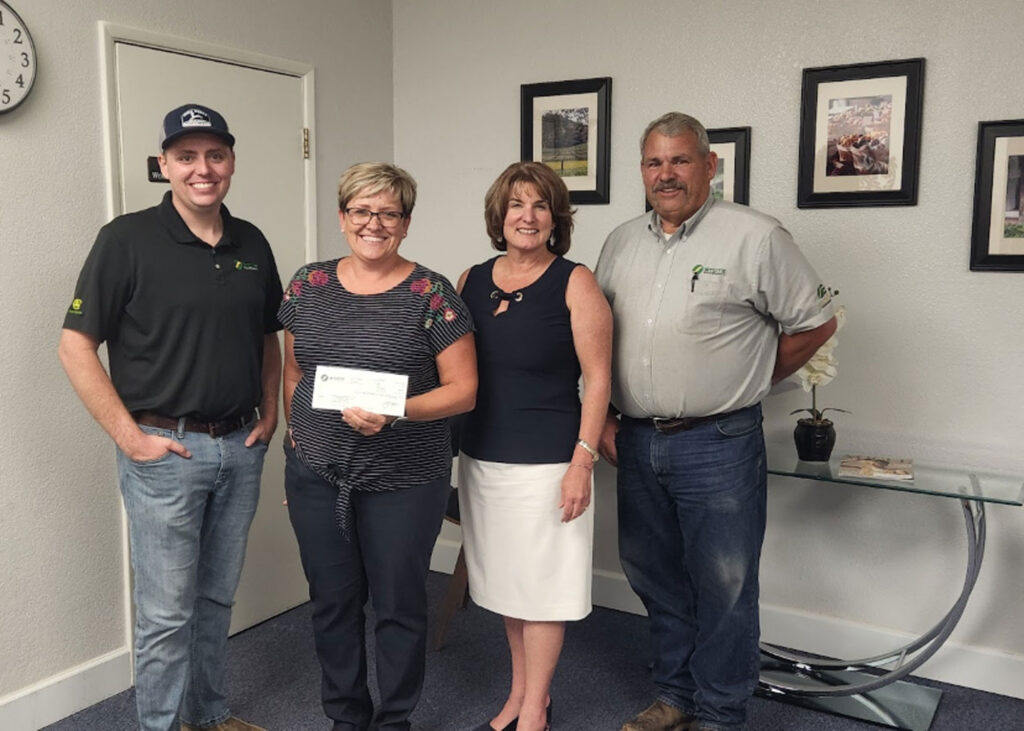
Stanfield Community | Stanfield Elementary - July, 2022
Ron Converse and Bryce Rothlisberger delivered another check to Jennifer and Melissa, administrators of Stanfield Elementary. They were very grateful to receive another donation from Stotz Equipment! The students at Stanfield Elementary are lucky to have these two administrators.


