Web Traffic & Web Updates Report | Q1 2022
Web Traffic & Analytics
1. Overall Traffic
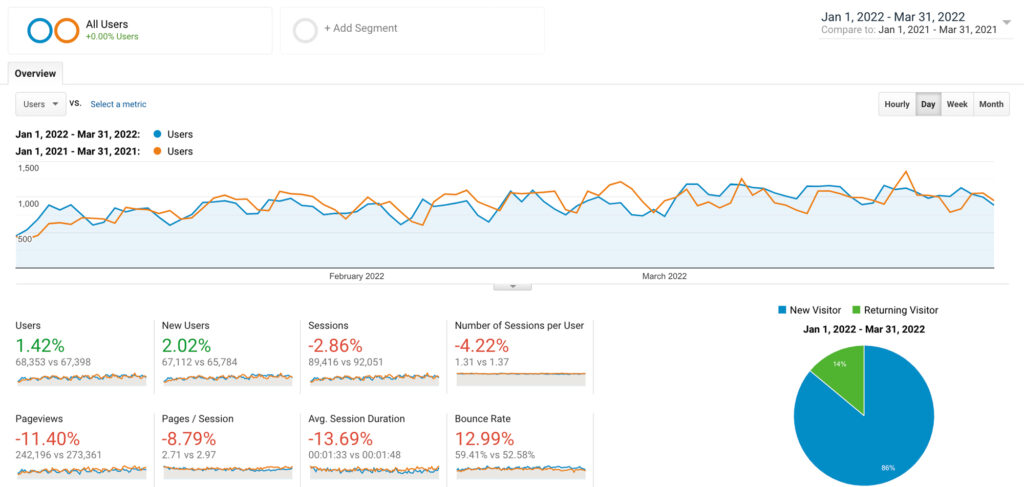
2022’s Q1 overall web traffic is consistent with that of 2021 Q1. As the graph demonstrates, there was a small increase in the overall number of website users, and of new users. Despite the increases being small, 1.42% and 2.02% respectively, any increase in these overall categories is a good thing.
The decreases in the sub-categories of sessions, page views, duration, etc. are all consistent with an overall increase in number of people using the website. They show opportunities for optimization but are not unexpected. The page views, session duration, and bounce rate, however, all show decreases larger than we would like to see. This would be cause for concern, if nothing on our website had changed since Q1 of 2021.
The diversification of site content and increased use of campaign-specific landing pages, as well as tailored news posts, account for these drops. The opportunity for improvement is to now hone these pages into stable touchpoint for site users.
The second week of January through the third week of February in particular, had an almost identical user pattern.
3. User location
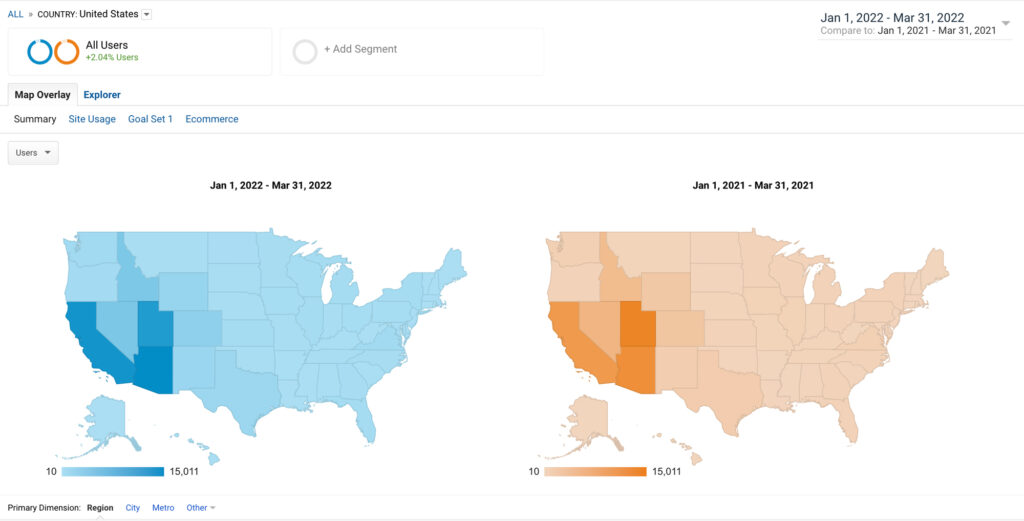
The location of website users in 2022 Q1 was consistent with that of 2021 Q1. This is a good thing as it shows that the vast majority the site content is reaching customers and potential customers.
In 2022 Q1, the largest number of site users were located in Arizona, with second largest in California, and the third largest in Utah. Last year’s first quarter showed the largest number of users in Utah, the second in Arizona, and the third in California. However, this change is a result of an overall increase of 25.62% in the number of users based in Arizona, and 33.5% in California. This is a really excellent improvement in user location metrics, meaning a lot more customers and potential customers in AZ and CA are using the website.
4. User Behavior/Content Flow
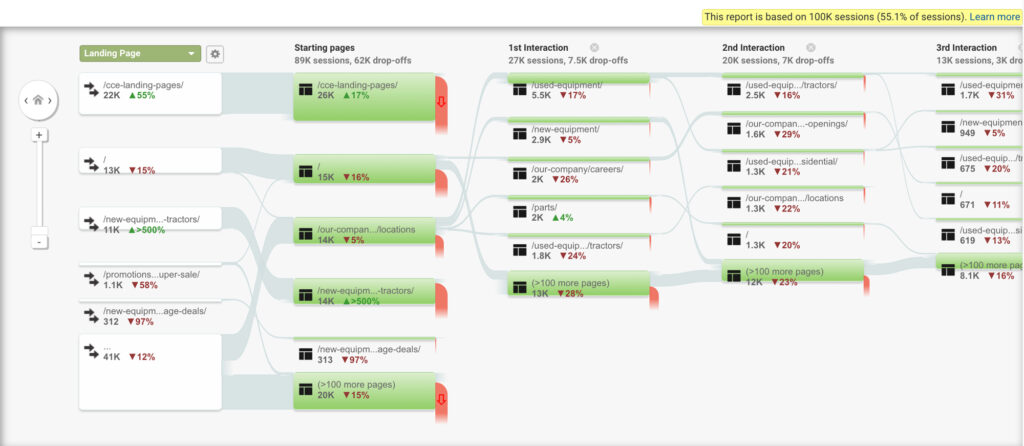
The website user behavior of 2022 Q1 visualizes many of the changes in content and strategy since 2021 Q1. Out of 100K sessions, 26K users first arrived on the site at the CCE landing page. This is a 17% increase over 2021. From there, 14% more users navigated to the used-equipment category and 35% more users navigate to the new-equipment category. Both are excellent behavior improvements, especially when noting that 10% less users navigated back to the home page, or away from the site.
There was also a 500% increase in the number of users who arrived at the site through the CUTs page. This is a result of a re-development of the CUTs page and using it for several campaign targets. From the CUTs page, users then navigated to each of the CUT sub-categories (1-4 series) by a factor of 92% increase. There was another 500% increase in the number of users who arrived at the CUTs page and then navigated to used equipment page.
All of these changes can be seen in the phenomenal efforts of the sales teams, who have far surpassed CCE sales goals, dramatically reduced the used inventory assets, and sold as many CUTs as they could get their hands on.
Finally, though there has been a minor decrease in the number of users arriving to the site through the locations page, more of those users navigated directly to the parts page. This is consistent with the expected increased demand in parts, that the parts department has been stocking ahead for, for some time.
5. User Acquisition
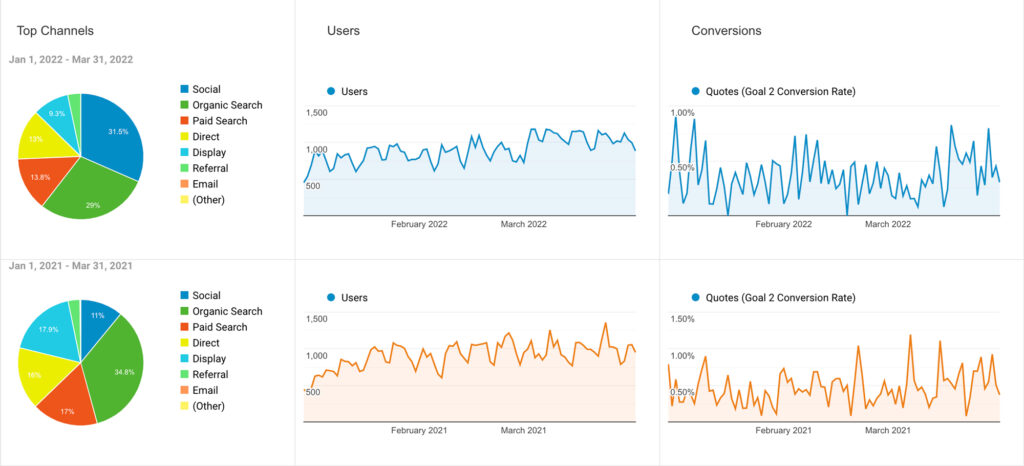
The user acquisition in 2022 Q1 shows some variation to that of 2021 Q1. The changes are due to strategy change, mostly in response to inventory challenges. The most notable changes are that of the nearly 20% increase in social-media-acquired web traffic and a proportional decrease in that of paid and display ads. Organic web traffic dropped by about 5%, consistent with the increase in social media traffic.
Website Updates & Improvements
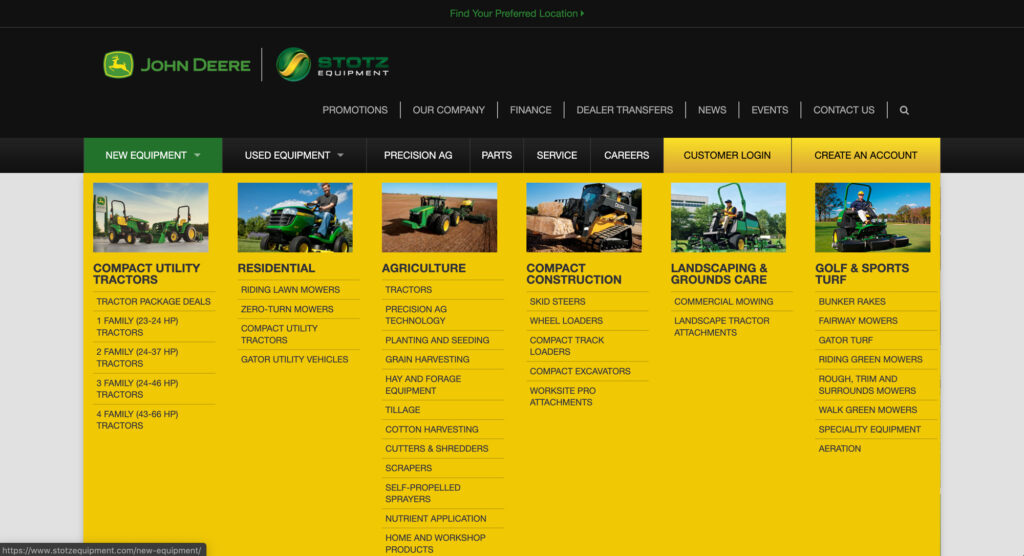
For several months, the Marketing team has been working on significant content organization and display changes in the new equipment sections of the website. Many of the changes have already been put in place: increased product descriptions, multi-media content from John Deere, and more intuitive behavior paths for users. Most notably, in the CUTs category and sub-pages resulting in the behavior increases shown in the previous analytics section.
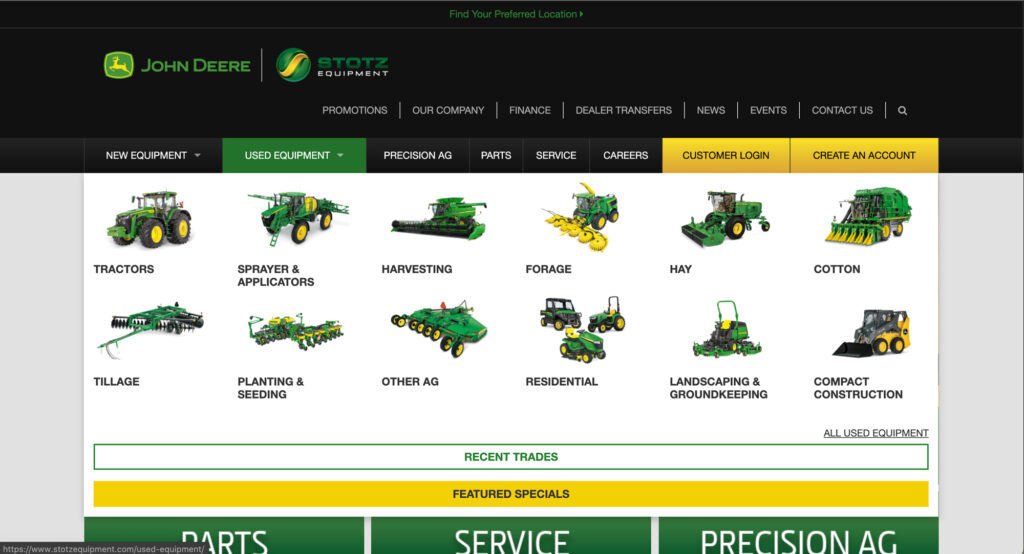
The final changes will be implemented shortly, culminating in a visual interface update to the new equipment navigation, which can be seen in the used equipment navigation. The used equipment category received a similar treatment in 2020-2021:
Marketing Center Updates & Improvements
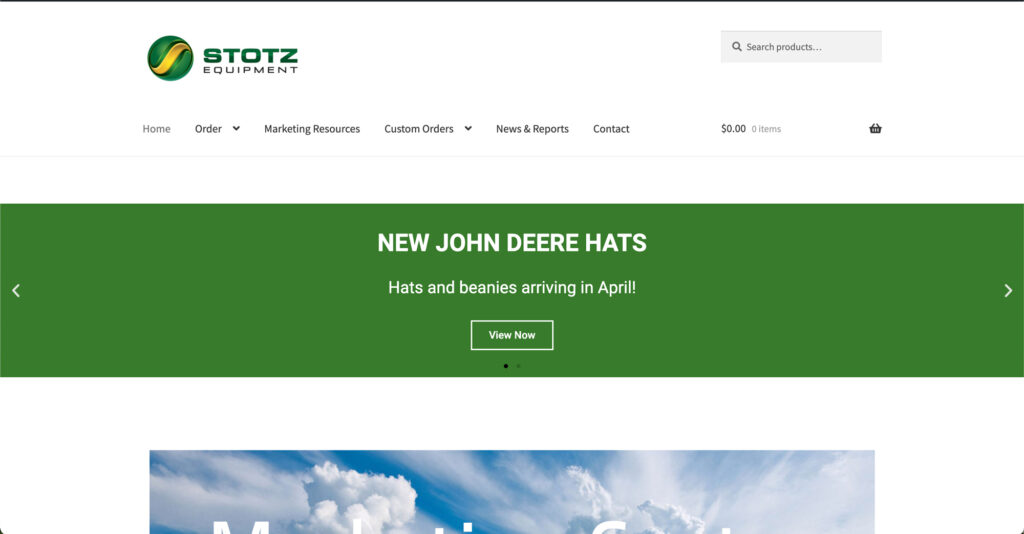
The Marketing Center now features an announcement banner section on the homepage, highlighting new items for order, resources, and information archives:
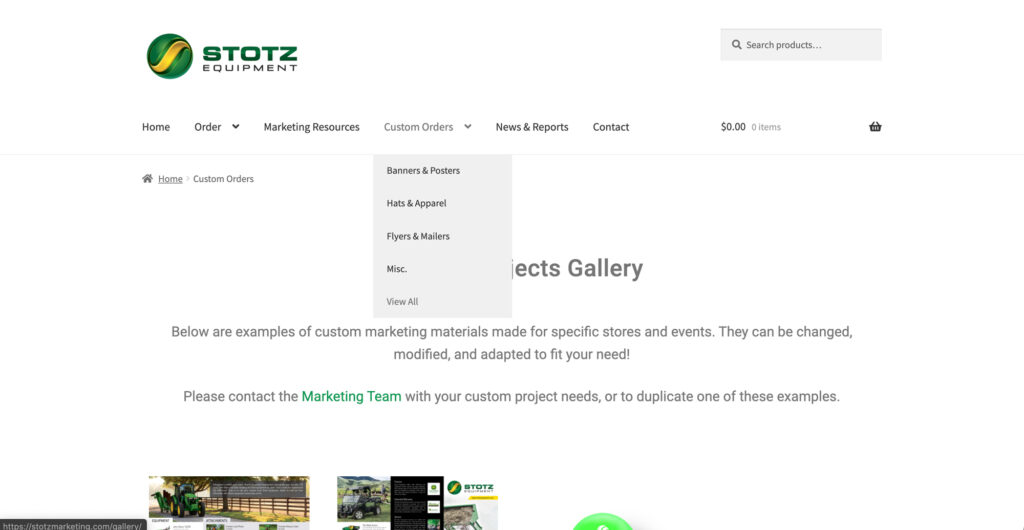
As a reminder, the Custom Orders section of the marketing center highlights individual projects the marketing team has recently completed. If you are ever wondering, “Can the marketing team help make this?” Check the Custom Orders section for a similar project, or for marketing inspiration.
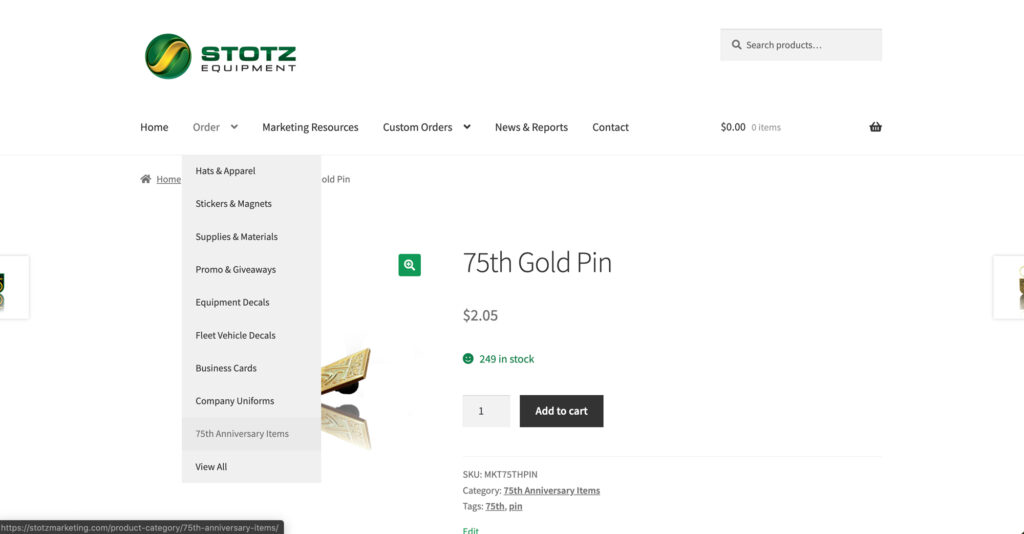
Finally, there are currently several Stotz Equipment 75th Anniversary items in stock and ready to order on the marketing center. More will be added soon!
Please contact the marketing team anytime with special requests for additional 75th anniversary items, or other promo items.